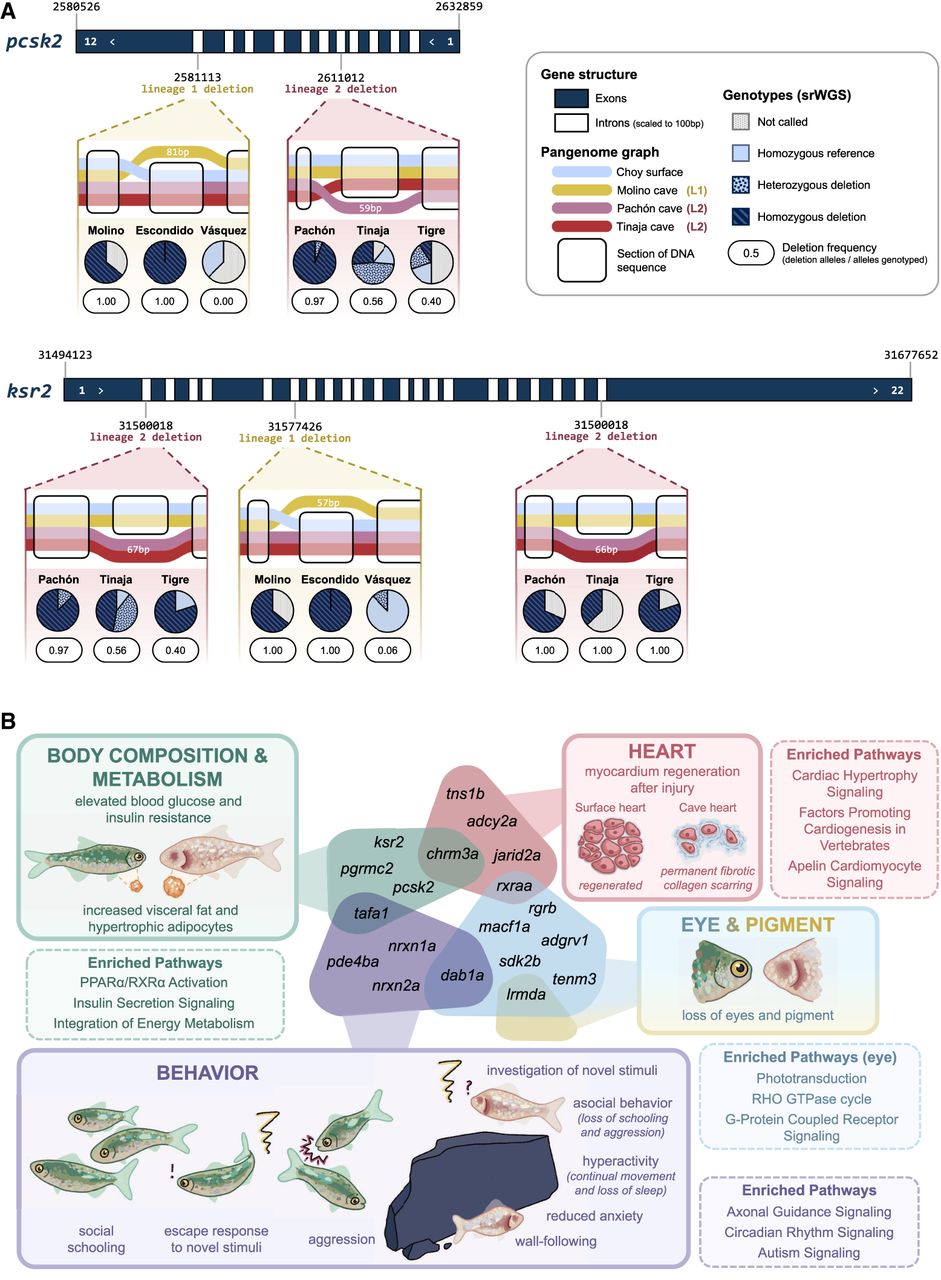
Repeated deletions and gene reuse between independently evolved cavefish lineages. (A) Details of the different deletions found in genes pcsk2 and ksr2 within each cavefish lineage. Introns have been scaled to 100 bp to visualize the entire gene structure in one image. Positions of gene start, deletion variant, and gene end are given in the Río Choy reference genome coordinates. Tube maps illustrate the deletion call within the pangenome graph, and pie charts show the genotype calls and population-level deletion allele frequency found through mapping short-read sequencing to the pangenome graph. (B) Putative relationships between genes containing deletions in both lineages and cave-derived phenotypes. Functional relevance for each gene was identified by exploring documented functional impact of the gene ortholog in zebrafish, mice, and humans, leveraging the databases Zfin, MGI, and OMIM and reviews of current literature (Supplemental Table S5C). Each bubble represents a suite of cavefish phenotypes, which are illustrated and compared with surface fish phenotypes in the corresponding boxes. The genes listed in each bubble have evidence of functional impact related to the cavefish phenotype indicated by the bubble. Examples of enriched pathways identified in ingenuity pathway analysis of focal deletions pertinent to the phenotypes are given in dashed boxes (for full list, see Supplemental Table S7A).