

Abstract
Structural variants (SVs) are increasingly recognized as key contributors to adaptive evolution, yet they remain underexplored compared with single-nucleotide variation. To understand how large-scale genomic changes shape repeated evolution, we leveraged multiple levels of sequence data across the powerful evolutionary model system of the Mexican tetra fish (Astyanax mexicanus). We constructed one of the first pangenome graphs from a naturally evolving vertebrate, enabling comprehensive discovery of SVs among 120 fish from 11 populations. We discover substantial amounts of structural variation and explore the roles of genomic biases and selection in shaping the distribution of these variants. More than 2400 high-confidence cave-specific deletions are enriched in biological pathways involved in vision, metabolism, and behavior and cluster nonrandomly in quantitative trait loci linked to cavefish traits. Additionally, 67 genes harbor unique deletions between independent cavefish lineages. These reused genes show evidence of population-specific selection (99% contain selective sweeps compared with 8%–15% in genes lacking SVs), indicating that deletions likely rose in frequency through repeated positive selection rather than drift. Together, these results reveal that recurrent deletion events have repeatedly contributed to the evolution of cave-adapted phenotypes and highlight deletions as underexplored contributors of adaptive evolution in extreme environments.
A central goal in biology is to understand how genetic variation shapes phenotypic diversity, particularly in the context of adaptation. Single-nucleotide polymorphisms (SNPs) are abundant, readily detected with existing technology, and have been extensively studied for their association with traits that have evolutionary and ecological relevance (Saunders et al. 2006; Williams and Oleksiak 2011). Yet, SNPs represent only a fraction of the genetic variation that can influence phenotype (Huddleston and Eichler 2016). Much of the remaining, and historically overlooked, variation arises from large-scale genomic alterations collectively denoted as structural variation.
Structural variants (SVs) are generally defined as sequence variants ≥50 bp in size (Sudmant et al. 2015). These variants include inversions, translocations, duplications or insertion of novel sequence, and deletions. Because of their large size and abundance in the genome, SVs account for substantially more sequence variation compared with SNPs (Huddleston et al. 2017; Catanach et al. 2019; Hämälä et al. 2021). Consequently, SVs may be particularly influential in shaping traits under strong selection pressure, as seen in hypoxic conditions at high elevation (Liang et al. 2024), as well as in cases of strong artificial selection in domesticated animals (Cumer et al. 2021; Andersson and Purugganan 2022; Liu et al. 2023). Convergent SVs have been identified in sheep and goats subject to selection for similar agricultural traits (Yang et al. 2024) and play a key role in rapid and repeated adaptation in ragweed (Battlay et al. 2025). Even loss-of-function SVs like deletions, which are generally presumed to be deleterious to fitness, have the potential to generate evolutionary novelties such as protection against disease (Dwivedi et al. 2019; Murray 2020) and contribute to adaptation (Albalat and Cañestro 2016; Sharma et al. 2018; Xu and Guo 2020; Monroe et al. 2021).
The large size and complexity of SVs, combined with the limitations of short-read sequencing and reduced detection sensitivity, have hindered accurate genome-wide discovery, genotyping, and analysis of SVs among populations (Huddleston and Eichler 2016; Sedlazeck et al. 2018; Mahmoud et al. 2019; Zhao et al. 2021). Fortunately, recent advances in pangenome graph methods now provide a more comprehensive framework for identifying and characterizing segregating SVs. First conceptualized by Tettelin et al. (2005), pangenomes are an alignment of multiple contiguous whole-genome assemblies that can capture more of the genomic diversity that exists within a species (Bayer et al. 2020; Eizenga et al. 2020). In contrast to mapping to a linear reference, pangenomes enable genotyping of SVs from short-read data (Hickey et al. 2020; Sirén et al. 2021) and reduce false negatives in the discovery of polymorphic SV alleles (Rice et al. 2023). For these reasons, pangenomes are the most informative approach to discover SVs that may affect phenotypes of interest. Although pangenomes have been generated for numerous agriculturally relevant species (Hirsch et al. 2014; Golicz et al. 2016; Montenegro et al. 2017; Zhou et al. 2022; Jiang et al. 2023; Li et al. 2023; Rice et al. 2023), this approach has been used for only a few naturally evolving populations (Ruggieri et al. 2022; Secomandi et al. 2023; Fang and Edwards 2024; Edwards et al. 2025; Quah et al. 2025). Existing pangenomes of wild populations have revealed links between SVs and adaptation, including nervous system development in Heliconius butterflies (Ruggieri et al. 2022) and disease resistance in the house finch (Fang and Edwards 2024), illustrating the power of this approach to uncover important and previously obscured genetic variation.
We generated a pangenome graph for a unique evolutionary model system, the Mexican tetra (Astyanax mexicanus). The Mexican tetra is a species of teleost fish that has independently colonized cave environments at least twice in its evolutionary history (Coghill et al. 2014; Herman et al. 2018; Garduño-Sánchez et al. 2023; Moran et al. 2023). As a result, Mexican tetras have at two distinct lineages (lineage 1 and lineage 2), each comprising both surface-morph and cave-morph populations. Cave populations likely diverged fewer than 200,000 generations ago from surface populations but continue to undergo gene flow with surface populations and both intra- and interlineage cave populations (Herman et al. 2018; Garduño-Sánchez et al. 2023).
Subterranean habitats, defined by perpetual darkness, low oxygen, and limited food availability, have repeatedly produced organisms with reduced eyes and pigmentation, as well as expansion of nonvisual senses (Schilthuizen et al. 2005; Niemiller et al. 2008; Klaus et al. 2013; Bloom et al. 2014; Yang et al. 2016; Behrmann-Godel et al. 2017). Like other subterranean organisms, Mexican cavefish consistently show loss of vision (Yamamoto et al. 2004; Krishnan and Rohner 2017) and pigment (Protas et al. 2006; Gross et al. 2009). Beyond these hallmark cave traits, Mexican cavefish have also lost the capacity to regenerate normal heart tissue after injury, an ability seen in surface fish and ancestral teleosts (Stockdale et al. 2018; Cutie and Huang 2021). In response to nutrient limitation, Mexican cavefish have altered metabolism (Riddle et al. 2018; Xiong et al. 2018, 2022; Medley et al. 2022) and exhibit behavioral changes including loss of social schooling (Kowalko et al. 2013), reduced aggression (Elipot et al. 2013), and hyperphagia (Aspiras et al. 2015). Although caves differ somewhat in their ecology (Mitchell et al. 1977; Elliott 2018), adaptation to a resource-limited, perpetually dark cave environment has proceeded in a similar manner at the phenotypic level across cavefish populations (Morris 2003; Hernández-Lozano et al. 2024).
The repeated evolution of similar phenotypes in Mexican cavefish has long intrigued evolutionary biologists, prompting efforts to uncover the underlying genetic basis of cave-derived traits. To this end, previous research has identified a handful of genes associated with cavefish phenotypes (for review, see Ponnimbaduge Perera et al. 2023) and a few SNPs that are thought to contribute to these traits. For example, missense mutations in mc4r and insra affect appetite and insulin signaling, respectively (Aspiras et al. 2015; Riddle et al. 2018), and a premature termination codon in pde6c impairs vision (Roback et al. 2025). These discoveries highlight the potential relevance of a few SNPs, but there remains a substantial gap in our understanding of the genetic basis underlying the repeated evolution of cavefish. We aimed to address this gap through a systematic exploration of structural variation in 120 Mexican tetra genomes. We present the first pangenome graph of genome-wide changes associated with cave colonization, discover substantial amounts of structural variation, and explore the roles of genomic biases and selection in shaping the distribution of SVs in independently evolved lineages.
Results
Overview of study design
Our sequencing and filtering strategy enabled us to examine SVs that likely arose after cave populations diverged from surface populations and compare SVs across independently derived cave lineages. Overall, using a total of 120 A. mexicanus genomes from four surface and seven cave populations, we identified structural insertions and deletions originating from two independent evolutionary events (Fig. 1A–D). These populations were selected to provide a robust sampling of cave and surface fish in each lineage (n = 56 for lineage 1, n = 64 for lineage 2), which allows for inter- and intralineage comparisons of structural variation.
Mexican tetra population overview. (A) Representation of surface- and cave-morph Mexican tetra fish. (B) Phylogenetic relationships of populations used in the present study (subset from full phylogeny constructed by Moran et al. 2023). Populations belong to two distinct lineages, with cavefish evolving in each lineage. (C) Map of cave locations and surface population sampling points, San Luis Potosí and Tamaulipas, Mexico. (D) Sequencing data sets and sample sizes for each population.

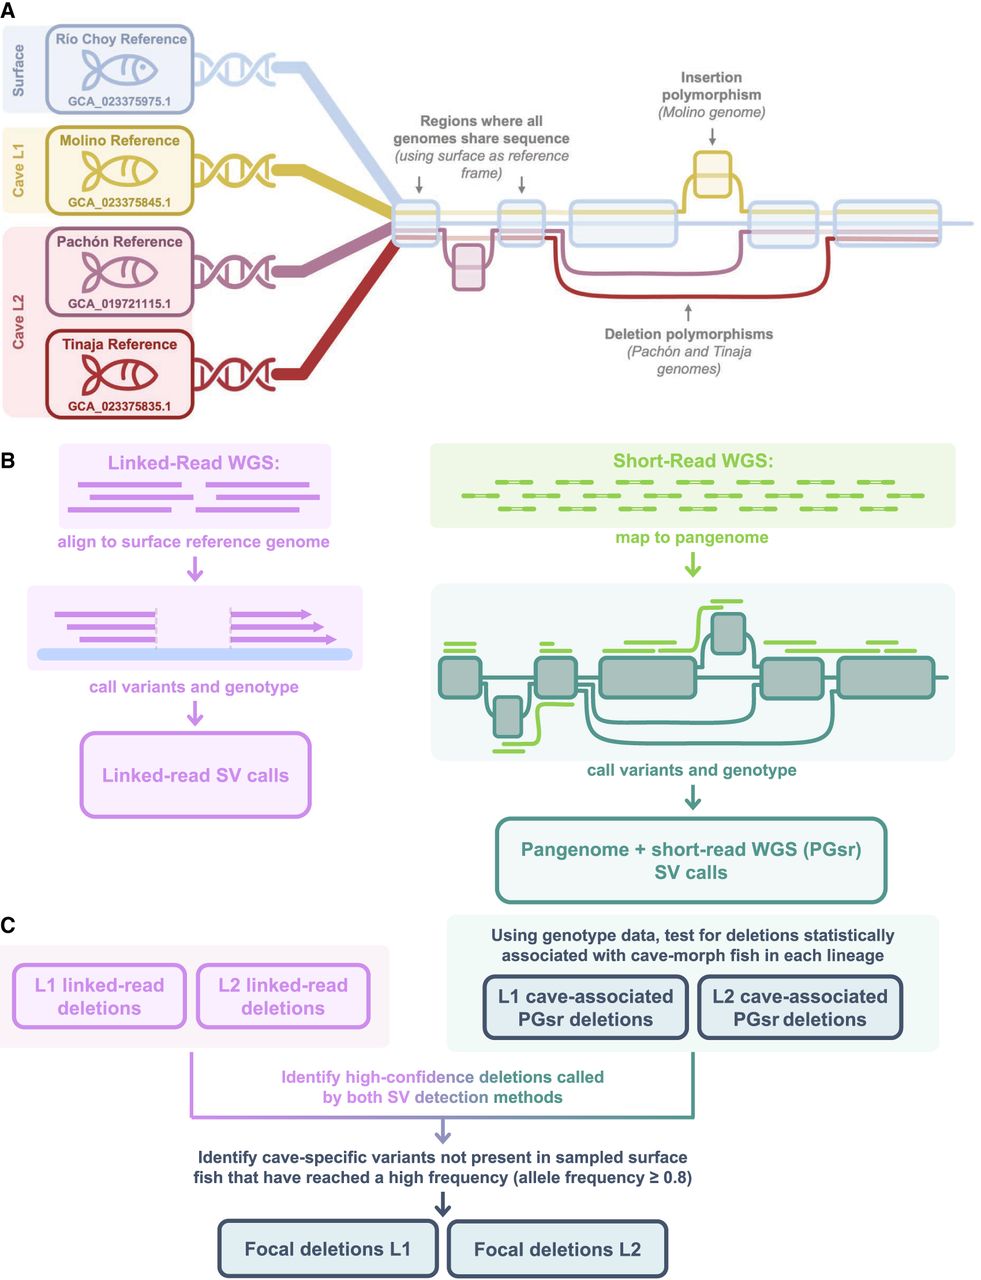
To identify SVs, we first generated a pangenome graph from four reference genomes (Imarazene et al. 2021; Warren et al. 2024) and identified insertion and deletion variants within the graph (Fig. 2A). We refer to these variants as pangenome SVs and characterize them across the genome. To enable further analyses, we obtained genotype information for variants across populations by mapping short-read whole-genome sequencing (WGS) data to the pangenome graph (Fig. 2B). We refer to this data set as pangenome+short-read WGS (PGsr). We focused all further analyses on the study of deletions. To identify variants phenotypically relevant to cavefish, we isolated deletions that were statistically associated with cave-morph fish in each lineage. From these deletions, we identified those that were consistently called across different SV calling methods, not present in any sampled surface population (Río Choy, Mante, Jalpan, and Rascón), and high frequency (deletion allele frequency ≥0.8) in cave populations (Fig. 2C). We refer to this final data set of most-filtered deletions as “focal deletions.” In some tests below, we compare genes with focal deletions to “control genes,” which contain no SV insertions or deletions within the gene structure in any population in the pangenome. For full study details, please see the Methods section.
Graphical overview of study design. (A) Graphical representation of pangenome graph construction using surface fish genome as a reference frame, as well as examples of insertion and deletions represented in the pangenome graph. (B) SV calling methods from linked-read sequencing (left) and mapping short-read sequencing to pangenome graph (right). (C) Integration of SV calls from different calling methods and filtering of SV deletion variants to generate a set of focal deletions used for downstream analyses.
Pangenome graph construction
Our Mexican tetra pangenome graph, generated from reference genomes of one surface- and three cave-morph individuals, consists of 52,571,860 nodes (sections of DNA sequence) and 72,140,066 edges (connections between nodes indicating that the given sequences are adjacent to one another in at least one genome). During graph construction, addition of the three cave-morph genomes to the pangenome graph contributed ∼400 Mbp of nonsurface sequence, attributable to 176 Mbp in Tinaja, 131 Mbp in Molino, and 94 Mbp in Pachón. We did not reach a plateau in new nonreference sequence nodes, indicating that inclusion of additional genomes would continue to grow the pangenome graph. Of the four reference genomes included, the pangenome graph used the Mexican tetra Río Choy surface fish reference (Warren et al. 2024) as a reference frame. Therefore, all results describe variation occurring in a population or individual relative to Río Choy, and genome positions are given in terms of the Río Choy coordinates.
Characteristics of pangenome SVs
From the pangenome graph, we identified variant sites: positions in the surface reference at which the cave reference genomes differ. For top-level indel variants (i.e., primary variants that are not nested within other variants, LV = 0) on chromosomes specifically, we identified a total of 1,100,450 sites with 1 bp indels, 1,359,534 sites with small insertions (<50 bp), 1,489,289 sites with small deletions (<50 bp), 236,786 sites with SV insertions (sequence gains 50 bp–100,000 bp), and 216,339 sites with SV deletions (sequence losses 50 bp–100,000 bp). We note that some sites affected by SVs are multiallelic, with unique SV alleles between caves. Across SV insertion sites, we found 338,631 unique insertion alleles, and across SV deletion sites, we found 255,331 unique alleles (Fig. 3A). SV alleles were more often shared within lineages than between lineages (lineage 1 = Molino, lineage 2 = Pachón and Tinaja). The majority (80.31%) of SV insertions and deletions we identified in the pangenome are ≤1 kb in length (Supplemental Fig. 1A). Alleles for structural insertions amount to an average of 138 Mbp per cave morph, whereas alleles for structural deletions amount to an average of 106 Mbp per cave morph (Fig. 3B). Our finding that insertions account for more base pairs compared with deletions is in line with findings from subterranean isopods, decapods, and mollusks, which have increased genome sizes relative to their surface counterparts (Lefébure et al. 2017). We find more total base pairs affected by SVs in the lineage 2 populations, Pachón and Tinaja, likely because the surface reference is from a Río Choy individual that belongs to lineage 1 and is therefore more closely related to the Molino cave population.
Structural variation identified between Mexican tetra reference genome assemblies. (A) Comparison of pangenome SV deletion alleles (left) and SV insertion alleles (right) by presence in each cave population (lineage 1 = Molino, lineage 2 = Pachón and Tinaja). Overlapping sections represent shared variant alleles between populations within the pangenome. Variants called relative to the Río Choy reference genome. (B) Total number of base pairs affected by pangenome SV insertions (positive values) and SV deletions (negative values) in each cave population. (C) Pairwise comparison of duplications (lower triangle matrix) and translocations (upper triangle matrix) in each of the four A. mexicanus reference assemblies. Variants called from pairwise whole-genome alignments between the two assemblies indicated by each cell (row × column). Values in each cell represent the total number of structural differences detected between the specific pair of assemblies. Duplication counts include both tandem and interspersed duplications but do not include tandem repeats. Darker cells indicate fewer variants identified between two assemblies and, therefore, more structurally similar genomes.

Additionally, we identified duplications and translocations between all pairwise combinations of the four A. mexicanus reference assemblies in the pangenome (Río Choy, Molino, Pachón, and Tinaja) (Fig. 3C). Each pairwise comparison resulted in about 1000–2300 variant calls for both duplications and translocations, representing far fewer variants compared with insertions and deletions. This finding is consistent with other within-species studies across taxa showing that indels outnumber translocations and duplications by more than two orders of magnitude (Long et al. 2018; Dhakal et al. 2024; Kaur et al. 2024). We found fewer duplications and translocations in the comparison of cavefish from the same lineage (Pachón and Tinaja) than in comparisons between cavefish lineages (Pachón or Tinaja compared with Molino). This finding further indicates that the Pachón and Tinaja genomes are more structurally similar to one another than to Molino.
Across the 26,736 Mexican tetra protein-coding genes, 18,016 (67%) have SV deletions and 17,715 (66%) have SV insertions in Molino, Pachón, or Tinaja within intron, exon, or UTR regions. Longer genes offer more mutational targets and are therefore more likely to contain variation (Lopes et al. 2021), a trend that is well supported in Mexican tetras (Moran et al. 2023; Roback et al. 2025). Likewise, we found that genes that contain no SV insertions or deletions are shortest in total base pairs (median = 4847 bp), followed by genes with SV insertions (median = 6538 bp), then genes with SV deletions (median = 7177 bp), and finally genes with both SV insertions and deletions (median = 23,880 bp; all groups different from one another through pairwise comparisons using Wilcoxon rank-sum test with continuity correction, all P < 0.01, average Cohen's d across all comparisons = 0.33) (Supplemental Table S1A). For genes that contain SV deletions, we find a bimodal distribution in which most genes have ≤25% of their total base pairs deleted, as well as a notable group of genes that are completely deleted (Supplemental Fig. 1B).
Overall, 50.85% of all SV deletions and 41.55% of all SV insertions affect introns. In contrast, relatively few SV insertions and deletions occur in exons. Across the three cave morphs in the pangenome, SV deletions affect exons of 2397 protein-coding genes and SV insertions affect exons of 1332 protein-coding genes. We find that SV insertions and deletions overlap CDSs less frequently than random (permutation test P < 0.005 for both insertions and deletions) (Fig 4A; Supplemental Table S1B) and overlap introns more frequently than random (P = 0.04 for deletions and P < 0.005 for insertions) (Fig. 4B; Supplemental Table S1B). Although both insertions and deletions are overrepresented in introns, the degree of overrepresentation is much greater for insertions. In intergenic regions (i.e., regions of the genome not within the gene structure), there are more insertions and fewer deletions than expected through random accumulation (P < 0.005 for both insertions and deletions) (Supplemental Table S1B). These results suggest that negative selection is likely removing SVs from coding regions, in line with findings in other animals (Liang et al. 2024).
Insertions and deletions are found nonrandomly within the genome. Results of a permutation test that places identified SVs into the genome at random and determines how frequently the variant overlaps regions of interest. The histograms illustrate the number of intersections between the SV and the given region in 300 runs of the random permutation test, and the dotted line indicates the observed number of intersections. (A) Intersections of deletions (left) and insertions (right) with coding sequence (CDS) regions. (B) Intersections of deletions (left) and insertions (right) with intron regions.

Because transposable elements can amplify and insert multiple times, they are inherently repetitive and abundant among insertion events. True to these expectations, SV insertions found in cavefish relative to the Río Choy surface reference are 78.6% repetitive on average across Molino, Pachón, and Tinaja (Supplemental Table S1C). Of this repetitive content, the largest contributors are retroelements (30.7% on average, including 21.3% from LTR elements) and DNA transposons (19.3%). The fact that insertions are largely composed of transposable elements may explain our finding that insertions are overrepresented within introns and intergenic regions (and more so than deletions), as transposable elements show location bias for noncoding regions, especially introns and regions flanking genes (Wei et al. 2016).
Finally, we predicted functional impacts of variants in the pangenome as characterized by SnpEff (Cingolani et al. 2012a). SV deletions represent 30.92% of all high-impact variants, and SV insertions account for 10.65% (Supplemental Fig. 1C; Supplemental Table S1D).
Identification of SV deletions from linked-read sequencing
To identify deletions using a different approach unrelated to the pangenome graph, we used linked-read sequencing from each of two surface populations and seven caves and called deletions relative to the linear Río Choy surface reference genome (Fig. 5; Supplemental Table S2). We obtained fewer deletion calls in Molino, Pachón, and Tinaja through the linked reads compared with the pangenome graph (∼1.7× more deletions were identified in the pangenome graph in Molino and 1.5× more in Pachón and Tinaja). This highlights the sensitivity of SV detection provided by the pangenome graph method compared with use of a linear reference, as also demonstrated by Rice et al. (2023).
Shared deletions between and within cavefish lineages. Heatmap depicting results of SV deletion calling from linked-read sequencing. Cells on the diagonal represent the number of deletions (50 bp–100 kb) called in each individual relative to the Río Choy reference after filtering for variants passing all Long Ranger quality filters. Darker cells on the diagonal represent a greater number of deletion calls. Cells within the triangle matrix represent the number of shared deletions between individuals from each pair of populations. Deletions were considered shared if they had 90% reciprocal overlap between populations. This cutoff increases the confidence that the variants originate from a shared SV-generating event, rather than repeated origins in a similar location. Darker cells in the triangle matrix represent a greater number of shared deletions between two populations. More deletions are shared within lineages than between lineages, in accordance with the best supported phylogenetic history of these populations.

From the linked reads, we identified the fewest deletions in the Jalpan surface individual (75,975 deletions), which is the most closely related population to the Río Choy reference (both lineage 1 surface populations). It is logical that we found the fewest deletions in the population most closely related to the reference used; however, the presence of nearly 76,000 deletions identified between individuals of the same lineage and ecotype suggests that there is substantial variation even between closely related populations with shared environmental pressures. We found the most deletions in the Rascón surface individual (94,619 deletions), which represents the divergence between lineage 1 and lineage 2, the deepest divergence time in A. mexicanus (Herman et al. 2018; Garduño-Sánchez et al. 2023; Moran et al. 2023). This finding is in line with the documented genetic diversity existing between surface populations belonging to different lineages. For example, the observed value of DXY (a measure of absolute nucleotide divergence) between Río Choy and Rascón is greater than any comparison of either surface population to a cave population (Herman et al. 2018). Although most population genetic measures of diversity such as DXY are derived from SNP data, our results highlight that there is also a high degree of structural diversity between surface populations from different lineages.
As with our finding for pangenome SVs, we found that linked-read deletions are most often shared between individuals of the same cave lineage rather than between cave lineages (Fig. 5), supporting current evidence that at least two cave lineages diverged from at least two separate surface lineages (Ornelas-García et al. 2008; Bradic et al. 2012; Herman et al. 2018; Moran et al. 2023). Additionally, the pattern of variation being shared within a lineage more commonly than between lineages has also been found in examination of other types of variants in this system (Roback et al. 2025). Overall, the number of deletions detected in each population relative to Río Choy and the comparative number of deletions shared between versus within lineages follow our expectations based on the documented evolutionary history of A. mexicanus.
Identification of high-confidence cave-associated focal deletions
To further explore deletions segregating in Mexican tetra populations, we used the pangenome as a reference for the alignment and genotyping of 107 short-read WGS samples from nine total populations (Fig. 1D; Supplemental Table S2). This approach allows SVs present in the pangenome to be confidently and accurately genotyped in many populations and individuals using short reads, which would not be possible with traditional linear reference alignments (Hickey et al. 2020; Sirén et al. 2021). We note, however, that this method does not identify additional variants that may exist in the WGS data, and therefore, there are likely many false negatives. In other words, our data set of genotyped variants is not an exhaustive list of all variants that exist in A. mexicanus populations.
Our genotyping yielded 279,995 PGsr deletions. To identify deletions statistically associated with cave-morph fish, we identified PGsr deletions present in each lineage and conducted lineage-specific runs of SnpSift CaseControl (Cingolani et al. 2012b) comparing lineage 1 caves to lineage 1 surface populations (Río Choy and Mante) and lineage 2 caves to the lineage 2 surface population (Rascón). We used the allelic model and Fisher's exact test with a Bonferroni–Holmes correction to assess differences in deletion allele frequencies between cave populations (i.e., cases) and surface populations (i.e., controls). We identified 23,032 deletions in lineage 1 and 6606 deletions in lineage 2 that were statistically associated with cave morphs (adjusted P < 0.05). The analysis in lineage 2 likely returned fewer deletions owing to artifacts of SnpSift CaseControl not because lineage 2 truly contains fewer cave-associated deletions (for full commentary, see Methods).
In line with best practices, we used multiple SV calling methods and retained SVs with consensus between linked-read and pangenome graph mapping approaches to increase confidence in our PGsr cave-associated deletion calls (Ho et al. 2020). Taking a consensus approach that combines both pangenome graph and linear reference-based methods significantly improves the precision of rare SV calls, which are more prone to false positives (Groza et al. 2024). Of the deletions associated with cave morphs by SnpSift CaseControl, 14,050 deletions in lineage 1 and 5246 deletions in lineage 2 were supported by linked-read deletion calls. Repeated sourcing of alleles from standing genetic variation is a prominent and important source of genetic convergence (Barrett and Schluter 2008) and is well documented in systems such as three-spined stickleback fishes, in which alleles associated with freshwater adaptation are frequently present in marine populations at low frequency (Colosimo et al. 2005; Jones et al. 2012). We identified whether our linked-read-supported, cave-associated deletions were present as a minor allele in related surface populations by identifying those with a surface allele frequency ≤0.2 and greater than zero. In lineage 1, 3437 cave-associated deletions (24%) are present as a minor allele in Río Choy and/or Mante based on our PGsr genotyping (mean deletion allele frequency; Río Choy = 0.11, Mante = 0.10). In lineage 2, 3222 cave-associated deletions (61%) are present as a minor allele in Rascón (mean deletion allele frequency = 0.09). The smaller proportion of lineage 1 deletions present as a minor allele in surface populations is likely an artifact of deletions being called against the Río Choy surface reference; if a deletion is present in the Río Choy population and represented in the Río Choy reference genome, the deletion will not be called in our data set because deletions are identified when sequence is missing relative to the Río Choy reference.
Although deletions can be repeatedly sourced from standing genetic variation, we specifically sought to explore deletions that have arisen because cave colonization and compare putatively independent deletion events between cave lineages. Therefore, we combined our cave-associated deletions from each lineage and isolated cave-specific deletions by removing deletions present at any frequency in any surface population (Río Choy, Mante, Jalpan, and Rascón; including all individuals from the linked-read and PGsr data sets). Finally, to identify deletions that have risen in frequency toward fixation, we required a deletion allele frequency of ≥0.8 in at least one cave population. As a result, we obtained a final set of 2431 unique deletions hereafter referred to as “focal deletions” (Supplemental Table S3).
Deletions identified as significantly associated with cave-morph fish in one lineage are not necessarily absent from the other; rather, they may exist at lower frequencies or lack sufficient genotype coverage to achieve statistical significance. Among the focal deletions in lineage 1, 73% are unique to that lineage (i.e., not present at any frequency in lineage 2), and 79% of focal deletions in lineage 2 are unique to lineage 2 (Supplemental Table S4A). Deletions unique to one lineage are almost always present in multiple caves within the lineage (99% of unique lineage 1 deletions are present in two or more lineage 1 caves and 97% of unique lineage 2 deletions are present in two or more lineage 2 caves). Approximately 26% of focal deletions are shared between lineages. These shared deletions may represent introgression between cave populations, reflect standing genetic variation that was undetected in our sampling of surface fish, or have arisen through similar de novo mutations.
In sum, we identify a set of 2431 focal deletions that are strong candidates to contribute to cave-derived phenotypes. These deletions are significantly associated with cave-morph fish according to SnpSift, are supported by both the PGsr data set and linked-read data set (i.e., are consistently identified across different SV calling methods), are absent in all sampled surface fish, and are high frequency (deletion allele frequency is ≥0.8) in one or more cave populations.
Characteristics of focal deletions
Like the set of all deletions identified in the pangenome, the majority (96%) of focal deletions (n = 2431) are ≤1 kb (mean = 202 bp, median = 80 bp) (Supplemental Table S4B) and occur in CDS regions significantly less often than would be expected through random accumulation (only 14 focal deletions are within exons, permutation test P < 0.003) (for more detail, see Supplemental Table S4C). Again, this suggests that overarching purifying selection removes deletions that occur in coding regions. Focal deletions intersect introns and intergenic regions no more often than expected under random accumulation (permutation test, P = 0.303 and P = 0.376, respectively) (Supplemental Table S4C). For focal deletions that occur anywhere within the structure of protein-coding genes (n = 1530), we do not find evidence that the distribution of the starting position of the deletion within the gene length differs from a uniform distribution (chi-squared comparison, X = 9.098, df = 9, P = 0.4283) (Supplemental Table S4D). Thus, focal deletions are not concentrated at certain positions along the gene structure.
The position of deletions in the genome may be biased by the sequence context in that region. For example, repeated deletions within the pelvic enhancer region of stickleback fish are thought to be stimulated by stretches of TG sequence repeats that are highly mutagenic (Xie et al. 2019). Because TG repeats can promote deletion mutations, we explored whether any of our focal deletions occurred at TG repeat sites. We found six deletions in lineage 1 and four deletions in lineage 2 that contained a TG repeat region of ≥20 bp (TG10+) (Supplemental Table S4E); however, none of the focal deletions at TG repeat sites are shared between lineages or occur within an overlapping region. We note one deletion of interest that occurs at a 54 bp TG repeat (TG27), a 1410 bp deletion fixed in the Molino and Escondido caves that begins 5413 bp upstream of ptprdb, a gene associated with diabetes risk and insulin resistance in humans (Chang et al. 2012).
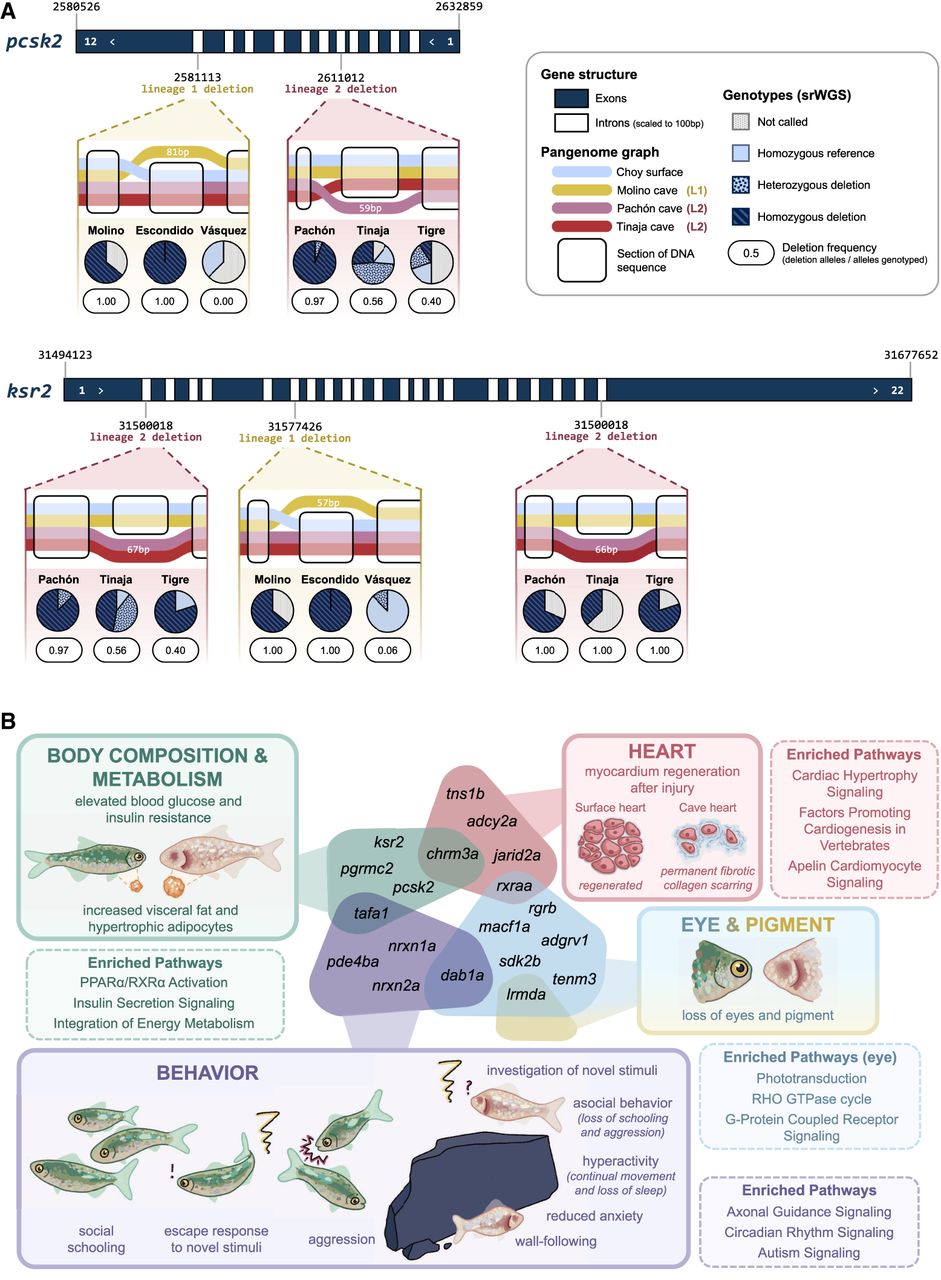
We identified only 13 shared focal deletions that are associated with the cave morph in both lineages (i.e., only 13 focal deletions are significant by SnpSift in both lineages) (Supplemental Table S5A) but find 67 instances of focal deletions in the same protein-coding gene but at different positions in different lineages (Fig. 6A; Supplemental Table S5B). Previous research has indicated that genes with large mutational target size are more likely to undergo repeated evolution (Gompel and Prud'homme 2009; Moran et al. 2023); correspondingly, we find that genes that repeatedly incurred unique deletions in each lineage are three times longer (in terms of total base pairs) than the rest of genes that bear focal deletions (median length for genes with repeated deletions = 231,341 bp, median length for all other genes impacted by focal deletions = 74,387 bp, pairwise comparisons using Wilcoxon rank-sum test with continuity correction P < 0.0001). This suggests that genomic biases such as length influence which genes are affected repeatedly in independent bouts of evolution.
Repeated deletions and gene reuse between independently evolved cavefish lineages. (A) Details of the different deletions found in genes pcsk2 and ksr2 within each cavefish lineage. Introns have been scaled to 100 bp to visualize the entire gene structure in one image. Positions of gene start, deletion variant, and gene end are given in the Río Choy reference genome coordinates. Tube maps illustrate the deletion call within the pangenome graph, and pie charts show the genotype calls and population-level deletion allele frequency found through mapping short-read sequencing to the pangenome graph. (B) Putative relationships between genes containing deletions in both lineages and cave-derived phenotypes. Functional relevance for each gene was identified by exploring documented functional impact of the gene ortholog in zebrafish, mice, and humans, leveraging the databases Zfin, MGI, and OMIM and reviews of current literature (Supplemental Table S5C). Each bubble represents a suite of cavefish phenotypes, which are illustrated and compared with surface fish phenotypes in the corresponding boxes. The genes listed in each bubble have evidence of functional impact related to the cavefish phenotype indicated by the bubble. Examples of enriched pathways identified in ingenuity pathway analysis of focal deletions pertinent to the phenotypes are given in dashed boxes (for full list, see Supplemental Table S7A).
Putative functional impacts of focal deletions and association with cave-derived traits
We explored the potential functional impacts for genes containing focal deletions in both lineages through inspection of documented phenotypes in gene orthologs from zebrafish, humans, and mice (Supplemental Table S5C). Many genes containing deletions in both lineages have documented phenotypic impacts related to cave-derived phenotypes (Fig. 6B).
Additionally, we identified biological pathways overrepresented among the set of genes affected by focal deletions in each lineage through ingenuity pathway analysis (IPA) of human orthologs of Mexican tetra genes. We found 224 enriched pathways in lineage 1 and six enriched pathways in lineage 2 (Benjamini–Hochberg adjusted P-values < 0.05) (Supplemental Table S6A). The smaller number of enriched pathways in lineage 2 reflects the lower number of cave-associated deletions identified in this lineage, resulting in fewer genes input for this analysis. All pathways enriched in lineage 2 were also enriched in lineage 1: RHO GTPase cycle, autism signaling pathway, synaptic adhesion-like molecules, ROBO SLIT signaling pathway, GABAergic receptor signaling pathway (enhanced), and neurexins and neuroligins. Despite this overall concordance in enrichment, mostly different genes in the same pathway incurred deletions between the two lineages (Supplemental Table S6B), indicating a pattern of convergence at the level of the pathway rather than of convergence at the gene level. To consider cases of deletions affecting a gene's regulatory sequence, we also ran pathway enrichment for genes with focal deletions within 5 kb upstream (four enriched pathways in lineage 1, one enriched pathway in lineage 2, no shared pathways) (Supplemental Table S6C) of and 5 kb downstream (no enriched pathways) from their coding sequence. Many enriched pathways correspond to the production of cavefish phenotypes including metabolism, eyes, heart, and behavior (when considering pathways significant in either lineage) (Fig. 6B).
Because most available RNA-seq data are derived from Pachón cavefish and Río Choy surface fish, we investigated the impact of focal deletions on Pachón gene expression. WGS genotype data and RNA-seq are not available for the same individuals, so we used only fixed focal deletions found in Pachón (obtained by filtering to only include deletions that have FST = 1 between Pachón and Río Choy surface, n = 155 deletions). We then identified genes containing a fixed deletion in cumulative exons and introns for the gene or within 5000 bp upstream of and downstream from the gene (n = 134 genes). Correspondingly, for this test we restricted our set of control genes (i.e., genes that contain no SV insertions or deletions in the gene structure) to also exclude genes with SVs within 5000 bp upstream of and downstream from the gene. We found that having a fixed focal deletion does not affect the likelihood that a gene is differentially expressed between Pachón cavefish and Río Choy surface fish in the eye at 54 h postfertilization (Gore et al. 2018) or in liver tissues (Krishnan et al. 2020) compared with control genes (Fisher's exact test, P > 0.05) (Supplemental Table S7A). Because surface Mexican tetras can regenerate heart muscle after injury whereas cavefish retain permanent scarring, we also explored differential expression in heart tissues at 3, 7, and 14 days after injury (Stockdale et al. 2018). We found that genes with fixed focal deletions are more likely to be differentially expressed at 7 days after injury (Fisher's exact test, P < 0.05) but not at 3 or 14 days after injury (Supplemental Table S7A). Additionally, we used a hypergeometric test that assesses whether a disproportionate number of differentially expressed genes contain fixed structural deletions in Pachón and obtain the same pattern of significance (P < 0.05 for hearts 7 days after injury, P > 0.05 for all other tissues) (Supplemental Table S7A). We might have identified differential expression in deletion genes in only the heart samples because examining RNA-seq at multiple time points can better capture dynamic expression patterns that are missed in single time point analyses like the liver and eye samples.
Of the 134 genes that have a fixed focal deletion in Pachón, we identified 20 genes with fixed deletions that are differentially expressed in the eye, 30 in the liver, and 33 in the heart across all time points, as well as 14 genes with fixed deletions that are differentially expressed in multiple tissues (Supplemental Table S7A). In accordance with the eye loss phenotype seen in cavefish, 85% of differentially expressed deletion genes in the eye are downregulated in the cave (Supplemental Table S7A). These results suggest that a subset of deletions likely have impacts on expression and therefore cavefish phenotypes, and these genes merit further examination.
Most QTLs identified in Mexican tetras are derived from crosses between Pachón cavefish and Río Choy surface fish (Wiese et al. 2024). Therefore, we again used fixed focal deletions in Pachón (n = 155 deletions) to identify whether deletions were associated with regions of the genome thought to contribute to cave-derived traits. Using previously established QTLs in Pachón mapped to the Río Choy surface reference by Wiese et al. (2024), we found that of the 155 fixed focal deletions in Pachón, 98 are found within a QTL region. We then ran a permutation test and identified that fixed deletions are found within QTLs more frequently than expected by chance and significantly more frequently than expected based on the frequency of Pachón deletions in the pangenome within QTLs (permutation test P < 0.005; Fisher's exact test P < 0.0005) (Fig. 7A; Supplemental Table S7B). These results show that focal deletions are enriched within genomic regions associated with cave-derived phenotypes such as reduction of pigmentation and expansion of taste buds (Protas et al. 2007), supporting their potential role in the genetic basis of these traits.
Deletions are enriched within QTL for cavefish traits and genes with evidence of selection. (A) Overlap between deletions and QTLs from previous studies of the Pachón cavefish population (see Supplemental Table S8B). The histogram illustrates the number of deletions fixed in Pachón (FST = 1 between Pachón and Río Choy, n = 155 deletions) that were found within Pachón QTL regions in each run of a permutation test that produces a simulated VCF with deletions placed into the genome at random. The dotted line indicates the true number of deletions within QTL regions (98 deletions). (B) Proportion of genes that contain deletions and selective sweeps in three unique gene sets: (PG) Genes containing deletions that are present in the pangenome but did not have a statistical association with cave-morph fish (n = 16,617), (FOCAL) genes containing focal deletions that have a significant association with the cave-morph and are not present in surface fish (n = 1260), and (REUSE) genes that contain a unique focal deletion in each cavefish lineage (n = 67). Genes must have a selective sweep and a deletion in the same cave population. Genes are placed into a category based on their highest level of association (e.g., a gene containing both a PG deletion and a FOCAL deletion is put in the FOCAL category). (C) Proportion of control genes (i.e., genes that contain no insertion or deletion SVs, n = 5265) that contain one or more selective sweeps in each cave population.

Genes with cave-associated deletions are more likely to be under selection
To assess whether deletions associated with cave phenotypes are more likely to be under selection, we identified whether genes containing deletions also showed evidence of selective sweeps in the specific cave population(s) in which the deletion is present. Evidence of selection was identified using diploS/HIC (Kern and Schrider 2018), a deep convolutional neural network approach that identifies sweeps from patterns of genetic variation. We identified the presence of sweeps in 5 kb windows across the genome within the Molino, Pachón, and Tinaja cave populations. In line with previous analyses (Moran et al. 2023; Roback et al. 2025), genes that contained one or more windows with a hard or soft sweep call were considered to have evidence of selection in the population(s) with the sweep call (i.e., a gene may have evidence of selection in no cave populations, one population, or multiple populations). Within these genes, we required that the deletion and selective sweep were present in the same population.
After identifying the presence of sweep windows within all genes, we compared three deletion gene sets: PG genes (genes with deletions in the pangenome that are not statistically associated with cave-morph fish and may also be present in surface fish), focal genes (genes with deletions that are associated with cave morphs and are not present in any sampled surface fish, consistent with above usage of this term), and reuse genes (genes that contain focal deletions at different positions in each cavefish lineage). We found that the proportion of genes with evidence of selection increased significantly with the level of cave-association: PG genes had the lowest proportion under selection (53%) followed by focal genes (62%), and reuse genes had the highest proportion under selection (99%) (pairwise comparison of each gene set using chi-squared test, all P < 0.0001) (Fig. 7B; Supplemental Table S5D). Therefore, genes with cave-associated deletions are significantly more likely to have population-specific selective sweeps than are genes with deletions not associated with the cave-morph phenotype. Further, genes that harbor unique deletions in each cave lineage are more likely to have evidence of population-specific selection, supporting their potential role in the repeated evolution of cave-adapted traits. We note however, that our analysis does not definitively show that there has been selection for the deletion variant specifically, only that a deletion and selective sweep co-occur within a gene in a population.
To provide an additional comparison, we explored how often control genes with no insertion or deletion SVs had evidence of selection in each population. Only 8%, 9%, and 15% of control genes had evidence of selection in Molino, Pachón, and Tinaja, respectively (Fig. 7C; Supplemental Table S5D), substantially less than the proportion of genes with deletions under selection. This result further supports the hypothesis that structural variation, particularly deletions, contributes to adaptation in cavefish.
Discussion
Thus far, comprehending the genetic basis of cave adaptation, driven by the strong selective pressures of darkness, food scarcity, and low oxygen, has involved examinations of single-nucleotide variation. Our understanding of the impact of structural variation on cave adaptation was concentrated on the unique deletions in the oca2 gene between cavefish lineages that play a dual role in both depigmentation and loss of sleep (Protas et al. 2006; Bilandžija et al. 2013; O'Gorman et al. 2021). In this study, we generated a pangenome reference for the Mexican tetra, A. mexicanus, representing one of the first pangenome graphs for naturally evolving populations (but see Ruggieri et al. 2022; Secomandi et al. 2023; Fang and Edwards 2024; Edwards et al. 2025; Quah et al. 2025). Our pangenome approach enabled us to comprehensively characterize structural variation between and within independently evolved lineages. Through our pangenome-guided investigation of deletions, we identified a high-confidence set of 2431 focal deletions associated with cave-morph fish. These deletions are consistently identified across different SV calling methods, are absent in all sampled surface fish, and are high frequency (deletion allele frequency is ≥0.8) in one or more cave populations.
Our investigation of deletions in Mexican tetra revealed a remarkable pattern of unique focal deletions within the same gene between cavefish lineages. There often exist multiple mutational routes to a phenotypic outcome, and this genotypic redundancy results in a reduced likelihood that the same gene should be repeatedly used in independent bouts of evolution (Yeaman et al. 2018). It is therefore especially interesting to find the same gene altered repeatedly, suggesting constraints guiding evolutionary trajectories and/or particularly advantageous fitness outcomes of changes at certain loci (Storz 2016). Beginning with Darwin, the evolution of loss-of-function traits in cave organisms has historically been attributed to drift and disuse rather than selection for loss (Darwin 1859; Wilkens 1988; Leys et al. 2005). However, genomic analyses of Mexican cavefish have shown that selection, as well as drift and relaxed constraint, prominently influences the evolution of cave-derived traits (Moran et al. 2023; Roback et al. 2025). Here, we found that although only 8%, 9%, and 15% of control genes with no SVs had evidence of selective sweeps in Molino, Pachón, and Tinaja, respectively, 99% of genes that repeatedly incurred unique deletions in each cave lineage had evidence of selection in the populations in which the deletion is present. These findings suggest that the presence of unique high-frequency deletions in the same gene in each lineage is not caused by chance or relaxed constraint simply allowing these variants to persist but by potentially repeated selection in these particular genes in cave populations.
As further evidence that genes in which deletions have occurred and risen in frequency repeatedly may play an important role in the production of cavefish traits, we found that genes with repeated deletions in each lineage have documented phenotypic impacts in model systems related to many cave-derived phenotypes. These traits include those related to the physiological and behavioral resilience to nutrient limitation. Given the lack of light, and therefore photosynthetic primary production, caves are inherently nutrient-limited environments. External nutrient input may arise through bats living in the caves or seasonal flooding (Culver and Pipan 2019); however, it is likely that many caves containing Mexican cavefish are consistently nutrient limited (Wilson et al. 2021). Correspondingly, cavefish can maintain body weight when starved and exhibit hyperphagic behavior when food is present (Aspiras et al. 2015). They also have enlarged fat cells and greater visceral fat (Xiong et al. 2018, 2022), as well as insulin resistance and elevated blood glucose (Riddle et al. 2018). We highlight two genes with repeated deletions between lineages and evidence of selection, pcsk2 and ksr2 (Fig. 6A), with convincing connections to these phenotypes. Pcsk2 has an 81 bp deletion in the fifth intron (of 11 total introns) in lineage 2 followed by a 59 bp deletion in the last intron in lineage 1. Reduced levels of PCSK2 (also called PC2), is implicated in Prader–Willi syndrome in humans, which is a disease characterized especially by insatiable hunger and often abnormal eyesight (Butler 1990; Gabreëls et al. 1998; Bohonowych et al. 2021). Additionally, in Pcsk2-null mice, processing of insulin and glucagon is impaired (Furuta et al. 1997, 1998, 2001). Ksr2 contains three focal deletions, a 67 bp deletion in lineage 2 in the first intron (of 22 total introns), a 57 bp deletion in lineage 1 in the sixth intron, and another 66 bp deletion in lineage 2 in the penultimate intron. Human KSR2 is located within a region associated with both obesity and type 2 diabetes (Bowden et al. 1997; Li et al. 2004). In mice, Ksr2 knockouts are obese and glucose intolerant and exhibit hyperphagia that is unresponsive to leptin, a hormone that signals feelings of fullness and consequently reduces hunger (Revelli et al. 2011). In fact, Ksr2 knockout mice are significantly more obese and glucose intolerant than Mc4r knockout mice, a gene with previously established causative SNP in cavefish (Revelli et al. 2011; Aspiras et al. 2015).
One phenomenon likely shaping our observed pattern of gene reuse is the presence of repeated environmental pressures. Repeatedly altered genes in multiple evolutionary events are also seen in the evolution of pelvic spine loss in freshwater three-spined stickleback (Chan et al. 2010), in the adaptation of Poeciliidae fish living in springs rich in toxic hydrogen sulfide (Greenway et al. 2020), and in waterfowl adapted to high-altitude hypoxia (McCracken et al. 2009), all systems with environmental pressures that are similar in each bout of adaptation. Results from experimental evolution have also demonstrated parallel genomic evolution in populations evolved in the same environment (Bailey et al. 2015), further suggesting that repeated environmental pressures are likely key influences on gene reuse. In vertebrates, relatively few studies have applied pangenome approaches to identify SVs, especially in association with adaptation to extreme environments. A small number of studies have begun to identify local adaptation linked to SVs (Quah et al. 2025; Gozashti et al. 2026); however, differences in methodology, phylogenetic timescales, and the more severe selective pressures characteristic of cave habitats limit our ability to compare the number of SVs and presence of gene reuse between systems. We look forward to future comparisons as more systems implement the type of analysis we conducted.
In addition to shared environmental pressure, characteristics of the genomic sequence may introduce biases that predispose certain genes for reuse. In line with previous research indicating that genes with large mutational target size are more likely to be subject to repeated evolution (Gompel and Prud'homme 2009; Moran et al. 2023), we find that genes that have repeatedly undergone unique deletions in each lineage are three times longer than the rest of genes in our set of focal deletions. This result further supports that longer genes offer more opportunity for mutations and suggests that genomic biases, such as gene length, influence tendencies for genes to be affected in repeated bouts of evolution.
When considering all focal deletions, not just those in the same gene between lineages, we find that fixed focal deletions in Pachón occur nonrandomly in regions of the genome within established QTLs for cave-derived phenotypes, supporting that these variants may contribute to the genetic basis of cavefish traits. Additionally, multiple biological pathways pertinent to cavefish traits are overrepresented among the set of genes affected by focal deletions. Among these pathways are circadian rhythm signaling, melatonin signaling, insulin secretion signaling, type II diabetes mellitus signaling, phototransduction, G-protein-coupled receptor signaling, and cardiac hypertrophy signaling. These pathways have clear connections to cavefish traits of circadian rhythm disruption and sleep loss, insulin metabolism, eye loss, and heart regeneration loss. We find that for pathways enriched in both lineages, deletions mostly affected different genes in the pathway in each lineage. This result illustrates that there also exists genetic convergence at the level of the pathway, but not at the precise level of the gene, in the repeated evolution seen in this system.
Among the genes harboring focal deletions, we identified a set of 14 genes that are differentially expressed between the cave and surface in multiple tissues, suggesting that they may have pleiotropic effects, impacting multiple cave phenotypes at once. One gene, ndst1b, contains a deletion in lineage 2 caves, is downregulated in cavefish in eyes, liver, and heart and is associated with QTLs in Pachón for eye size, dentition, and body condition (Protas et al. 2007, 2008). In zebrafish and mice, knockdown of ndst1b causes altered neural crest development, with consequences for craniofacial development, eye defects, shortened body and pectoral fin length, and alterations to chromatophore distribution (Grobe et al. 2005; Filipek-Górniok et al. 2015), consistent with the changes in craniofacial and fin morphology and pigment loss in Mexican cavefish (Yamamoto et al. 2003; Protas et al. 2008, Powers et al. 2017, 2018; Atukorala et al. 2019). Neural crest cells play a key role in the development of multiple cave phenotypes, and transplantation of cranial neural crest cells from surface fish results in increased pigmentation and eye size in cavefish (Yoshizawa et al. 2018). The deletion identified in ndst1b occurs in the second intron, and ndst1b is significantly downregulated in multiple tissues in cavefish, suggesting that the deletion may have a regulatory effect and could be relevant to multiple cavefish phenotypes. This deletion, and many others (including those discussed prior) (highlighted in Figure 6B and in Supplemental Table S5) represent exciting targets for further research using transgenesis and gene-editing technology (Stahl et al. 2019) to better understand the functional contribution of deletions to cavefish phenotypes.
In this study, we demonstrate that SVs are nonrandomly distributed across the genome and provide further evidence that longer genes represent larger mutational targets for SVs and are more often subjected to recurrent disruption during independent evolutionary events. We identify patterns of convergence at the level of the pathway and the gene and provide multiple lines of evidence that deletions may contribute to the emergence of cave-derived phenotypes including that (1) fixed deletions are found nonrandomly within established QTL regions associated with cave traits; (2) focal deletions affect genes with known roles in cave-like traits; and (3) focal deletions are enriched in relevant biological pathways. Furthermore, genes harboring deletions are more likely to bear signatures of selection compared with control genes without SVs. Although 8%–15% of control genes had evidence of selection in cave populations, 99% of genes that have repeatedly incurred unique deletions across cave lineages also have evidence of selective sweeps in caves, suggesting that this pattern is not simply the result of relaxed constraint but reflects repeated, lineage-specific selection on parallel genetic changes. In sum, our results support a model in which deletions may be contributors to adaptive trait evolution, enabling convergent solutions to similar ecological challenges.
Methods
Pangenome construction and processing
We built a pangenome from autosomal sequences of the surface-morph and three cave-morph A. mexicanus assemblies AstMex3_surface (Río Choy), AstMex3_Molino (Molino cave), AstMex3_Tinaja (Tinaja cave), and AMEX_1.1 (Pachon cave) (Imarazene et al. 2021; Warren et al. 2024). We ran the Minigraph-Cactus pipeline (Hickey et al. 2024) using the cactus v2.4.2 Docker image as described previously (Rice et al. 2023). We specified the Río Choy surface assembly as the reference to aid in the identification of variation existing in cave-adapted fish relative to those on the surface. The graph was output in multiple formats, including GFAv1.1, hal, vg, and VCF.
As default in cactus 2.4.2, the VCF was postprocessed with vcfbub, which exposes the snarl tree to annotate top-level (LV = 0) and nested variants (LVs > 0). We subset the graph to only include top-level variants (“vcfbub -l 0”) for all subsequent analyses. Although an updated version of Minigraph-Cactus left-aligns this VCF with BCFtools norm (Danecek et al. 2021), the version used in this study (v2.4.2) lacked normalization as a default. We initially postprocessed the top-level VCF with BCFtools norm but, in doing so, observed negative impacts of the left alignment, wherein variants were reassigned new coordinates that made them both incompatible with other formats of the graph (e.g., HAL, GFA, and VG) and incompatible with one another (e.g., an individual cannot have two different alternate genotypes at the same site) (https://github.com/ComparativeGenomicsToolkit/cactus/issues/1557). We chose to use the top-level VCF without left alignment for all subsequent analyses. As a final postprocessing step, we subset the top-level, unnormalized VCF to lines in which at least one individual (Molino, Pachón, or Tinaja) had an alternate genotype. Given that our input assemblies are haploid compressed genome assemblies, each “genotype” in the pangenome is a single allele (e.g., “1” instead of “1/1”).
Pangenome genotyping
In the postprocessed VCF, variant types were categorized based on the length of the alternate (ALT) allele and the length of the reference allele (REF) after splitting multiallelic sites. SVs were defined as those ≥50 bp and up to 100 kbp, in accordance with other pangenome approaches (e.g., Fang and Edwards 2024). To set equal thresholds across insertions and deletions, we categorized the structural insertions >100 kbp as “large structural insertions.” Similarly, 1 bp indels, small insertions (2 bp–49 bp), and small deletions (2 bp–49 bp), were defined through inspection and subtraction of the ALT and REF alleles. We defined 1 bp indels as 1 bp sequence gains or sequence losses that do not, otherwise, meet the criteria of being a multinucleotide polymorphism.
Pangenome summary statistics
Variants on unplaced scaffolds were excluded from pangenome summary statistics reported in the paper. Throughout the paper, a gene is defined in accordance with the NCBI definition used for GTF files, in which “gene” describes coordinates encompassing all isoforms of a gene (the union of all introns and exons). For this study, we only analyzed protein-coding genes. Statistics regarding the relationship of SVs to different genomic features, other than repetitive elements, were calculated based on the annotation of the pangenome VCF (see section “Annotating genomic features of SVs”). Calculations of gene length, proportion of gene deleted, and position of deletions within a gene were all calculated based on the gene coordinates specified in the GTF.
Identification of repetitive regions within insertions
We used RepeatModeler 2.0.4 (Flynn et al. 2020) with the -LTRStruct option to create libraries of transposable elements for the surface and each of the cave-morph genome assemblies. For each assembled cave morph, we subset the VCF to contain only insertions present in that genome assembly. We converted column 5 of the resulting VCF to a FASTA file and used this, along with the repeat-families.fa output of RepeatModeler as described above, as input to RepeatMasker v4.1.7-p1 (Tarailo-Graovac and Chen 2009) with default parameters.
Identification of duplications and translocations
We used the Synteny and Rearrangement Identifier SyRi v1.6 (Goel et al. 2019) to identify duplications and translocations between all pairwise combinations of the four A. mexicanus reference assemblies in the pangenome (Río Choy, Molino, Pachón, and Tinaja). SyRI was run with default parameters, and DUP and TRANS parent-level records were extracted from the output and counted for each pairwise comparison.
Annotating genomic features of SVs
To identify the impacts of SVs in A. mexicanus, we annotated the pangenome VCF using SnpEff 5.2a (Cingolani et al. 2012a) with informed breakpoints. The SnpEff database was built from the AstMex3_surface reference using the NCBI GTF. Custom annotations were provided for population-specific sweeps, as well as QTLs from Wiese et al. (2024) using the –interval option. Additionally, we added the tag “CDSID:” using coordinates from AstMex3_surface NCBI GTF with the –interval option.
Short-read WGS genotyping of surface and cave populations
We mapped and genotyped short-read surface- and cave-morph population data (for full information and sequence accessions, see Supplemental Table S2) to the pangenome graph described in this study using vg giraffe with default options (Sirén et al. 2021). GAM format files were surjected to BAM format with surface serving as the reference genome using the command “vg surject” with default options. Only SVs within 50 bp–100 kbp were retained for downstream analyses.
Linked reads generation and SV genotyping
To identify deletions using a different approach unrelated to the pangenome graph, we used 10x Genomics linked-read sequencing of nine individuals from two surface populations (Jalpan and Rascón) and seven caves (Escondido, Molino, Japones, Pachón, Tigre, Tinaja, and Vásquez). All processing of the linked-read data and SV calling was completed using Long Ranger (v2.2.2) (Zheng et al. 2016). We generated FASTQ files from the Illumina binary base call sequence output by running longranger mkfastq and created a 10x compatible reference from the A. mexicanus surface fish reference genome (GCF_023375975.1) using the longranger mkref command. We then ran Long Ranger in whole-genome mode (wgs). The longranger wgs command performs alignment of sequences to the reference genome, deduplication, and filtering and uses the Chromium molecular barcodes to call and phase SNPs, indels, and SVs. From the phased SVs called by Long Ranger, we retained only variants 50 bp–100 kb in length that passed all filters tested in the pipeline. These filters use barcode and phasing information to improve the quality of variant calls and reduce false positives (for a description of the filters in the Long Ranger pipeline, see https://support.10xgenomics.com/genome-exome/software/pipelines/latest/output/vcf). To determine the number of shared deletions between each population pair, we used BEDTools intersect (Quinlan 2014) to identify and count deletion SV calls with ≥90% reciprocal overlap. This level of overlap increases the likelihood that deletions being counted as shared are indeed comparable variants rather than unique deletions in similar positions.
Identifying a high-confidence set of cave candidate deletions
We integrated short-read genotyping with linked-read genotyping, employing stringent filtering criteria and a statistical test to identify SVs associated with cave-morph fish. First, we identified deletions in the PGsr data set statistically associated with cave-morph fish using SnpSift (Cingolani et al. 2012b). The allelic model implemented in SnpSift's CaseControl analysis (v5.2) utilizes the Fisher's exact test to assess statistically significant associations between genotype and phenotype. This test is effective in identifying variants exhibiting a high frequency of ALT alleles in case samples with a high frequency of REFs in control samples. We applied this test in a phylogenetically informed framework, treating cave samples as the “case” and surface samples as the “control.” To account for the independent origins of the cave phenotype in lineage 1 and lineage 2, we performed separate analyses for each lineage using the postprocessed PGsr data. Only SV deletions were included as input, with multiallelic sites joined. We adjusted P-values with Holm–Bonferroni correction using a custom code written with pysam (v. 0.22.1) (https://github.com/pysam-developers/pysam) and the multipletests() function in statsmodels 0.14.0 (Seabold and Perktold 2010), setting the significance threshold to adjusted P = 0.05.
We likely identified fewer significant deletions in the lineage 2 SnpSift CaseControl analysis owing to (1) reduced statistical power resulting from fewer surface individuals in lineage 2 (lineage 1 = 19 controls [i.e., surface], 31 cases [i.e., cave]; lineage 2 = 12 controls, 45 cases) and (2) an artifact of using the Río Choy surface reference wherein a multiallelic site with an alternate Rascón allele (the lineage 2 surface population/control) would be excluded by SnpSift owing to the absence of reference genotype in the control samples. We also note that variants deemed significant in the SnpSift CaseControl analysis are only those for which there was high genotype coverage resulting from mapping the short-read WGS to the pangenome. Therefore, we can confidently say these deletions are associated with cave-morph fish, however, there are likely additional deletions that are potentially biologically relevant but do not meet our threshold for significance. For instance, deletions in oca2 are well documented in cavefish (first identified by Protas et al. 2006) and present in our PGsr deletion data set but are not identified as significant through SnpSift CaseControl owing to reduced genotype coverage in our samples.
In investigations of structural variation, the confidence of SV calls is increased using multiple SV calling methods and retaining calls with consensus between programs (Ho et al. 2020). Generally, a 50% reciprocal overlap between callers is used to determine high-confidence SV calls (Sudmant et al. 2015; Audano et al. 2019; Kosugi et al. 2019; Ho et al. 2020). We generated a set of high-confidence SV deletions from PGsr genotyping by requiring a ≥50% reciprocal overlap with a deletion call from Long Ranger in a linked-read cave sample from the same lineage.
Next, we isolated cave-specific deletions in a two-step filtering process. We first removed deletions with a ≥50% reciprocal overlap with deletions called in the linked-read surface samples (Jalpan for lineage 1 and Rascón for lineage 2). Second, we calculated the population-specific frequency of our high-confidence deletions from PGsr genotyping using a custom script and required an ALT allele frequency of zero in all sampled surface populations (lineage 1: Río Choy and Mante; lineage 2: Rascón).
Detection of genome-wide selective sweeps
To find genomic regions possibly associated with adaptation, we identified regions of the genome with evidence of selective sweeps using diploS/HIC (Kern and Schrider 2018). This method combines a convoluted neural network approach and calculation of population genetic statistics from sequence data to infer selection. diploS/HIC requires empirical population genetic information in VCF format. We generated this input using the same srWGS data used to genotype pangenome SVs, focusing on the populations with the most individuals sequenced: two surface populations (Río Choy and Rascón) and three cave populations (Molino, Pachón, and Tinaja) (for sequence accessions, see Supplemental Table S2). We first performed genotyping against the Río Choy surface reference (Warren et al. 2024) using the Genome Analysis Toolkit (GATK) (Van der Auwera and O'Connor 2020) v4.4.0 GenotypeGVCFs tool to produce a VCF file for each population. We then subset these VCFs to only include SNPs and removed any SNPs that occurred within indels or a 3 bp buffer region on either side. We followed GATK best practices (https://gatk.broadinstitute.org/hc/en-us/articles/360035890471-Hard-filtering-germline-short-variants) to hard-filter SNPs and removed SNPs that occurred within repetitive regions using the NCBI WindowMasker files.
Next, we simulated population genetic data under neutral, soft, and hard sweeps in discoal (Kern and Schrider 2016), using the same demographic parameters as in a past run of diploS/HIC in Mexican tetra (Moran et al. 2023). We created separate simulated data sets for surface and cave to account for past population size changes and reduce the potential for false positives resulting from population bottlenecks that can cause neutrally evolving genomic regions to exhibit low genetic variation mimicking a selective sweep. For example, the cave demographic model includes a harsh bottleneck in line with the timing of cave colonization that dramatically reduces the effective population size. We then generated summary statistics and feature vectors for the simulated surface and cave data sets, which we used to train and test the convoluted neural network and produce a model for cave and surface. Finally, we supplied our VCFs containing real population genetic data to the trained diploS/HIC model, which generated another set of summary statistics and feature vectors that were used to predict selection in 5 kb windows across the genome. Each window was classified as being neutral, as containing hard sweeps or soft sweeps, or as being linked to a region that experienced a hard or soft sweep. Windows with no call were removed. Although diploS/HIC is a powerful approach to detect regions of the genome containing selective sweeps versus those that do not, it is not as reliable at distinguishing hard sweeps from soft sweeps (Kern and Schrider 2018). For this reason, we grouped hard and soft sweeps as evidence of selection and do not distinguish between the two. To further increase the confidence of our selection calls, we then swapped the underlying demographic models (running the cave population genetic data set with the surface demographic model and vice versa) and retained only windows with consistent calls between models.
To determine whether a gene had evidence of selection, we identified diploS/HIC windows within genes using the NCBI AstMex3_surface GTF gene coordinates. Following the procedure from previous analyses (Moran et al. 2023; Roback et al. 2025), genes that contained one or more windows with a hard or soft sweep call were considered to have evidence of selection in the population(s) with the call. Given that SV deletions span many base pairs and result in removed sequence context, it is difficult to accurately identify whether deletions are found exactly within a selective sweep. However, the population-specific nature of this analysis enabled us to identify genes that harbor a deletion in a certain population and simultaneously have evidence of selection in the same population. We then compared three sets of genes containing deletions: PG genes (genes with deletions in the pangenome that are not statistically associated with cave-morph fish; these genes may be present in surface fish), focal genes (filtered set of genes with deletions that are associated with cave morphs and are not present in any sampled surface fish), and reuse genes (genes that contain focal deletions at different positions in each cavefish lineage and are not present in our surface fish samples). The proportion of genes with evidence of population-specific selection (i.e., the deletion variant and selective sweep are both present in the gene in the same population) was then compared between each gene set using a pairwise chi-squared test (Supplemental Table S5D). Control genes (those containing no insertion or deletion SVs in any population) were considered to have evidence of selection if they contained one or more windows with a hard or soft sweep call.
Permutation testing of SV prevalence
To assess how the distribution of structural deletions across different genomic features (CDSs, introns, and intergenic regions) differ from chance, we ran a permutation test using a custom script. This test randomizes positions in the VCF, restricted to the lengths of the chromosomes, and generates a user-specified number of permuted VCFs. We generated 300 permutations of pangenome structural deletions. We annotated these with SnpEff following the methods previously described (see section “Annotating genomic features of SVs”). We also ran permutation tests on lineage 1 and lineage 2 focal deletions to test relationships of cave-associated deletions to selective sweeps in cave populations, QTLs, CDSs, introns, and intergenic regions. We used a Fisher's exact test to ascertain how the distribution of focal deletions differs from overall population-specific deletions in the pangenome.
Orthology inference
We used OrthoFinder v3.0.1b1 (Emms and Kelly 2019) to identify human orthologs of genes with focal deletions. Briefly, we used the same methods and species sampling as our prior study (Warren et al. 2024), but whereas the prior study used Ensembl gene predictions as input, here we used NCBI gene predictions. The metadata associated with input species/annotations and a summary of the orthogroup assignments are reported in Supplemental Table S8. Assignment of gene symbols to corresponding stable identifiers was accomplished with scripts reported in our prior study (Warren et al. 2024).
Pathway analysis
We performed signaling pathway overrepresentation tests for statistical significance using IPA (Krämer et al. 2014). For each lineage, we identified three sets of genes: (1) genes with deletions within an intron or exon, (2) genes with deletions within 5 kb upstream of the start codon, and (3) genes with deletions within 5 kb downstream from the stop codon. For each Mexican tetra gene, we identified the human ortholog from our OrthoFinder analysis. Genes with single-copy human orthologs were used as input for IPA because A. mexicanus is unavailable in this software. Each of the three gene sets was run independently for each lineage (six runs in total). Significant pathways were those that had a Benjamini–Hochberg adjusted P-value < 0.05. To not inflate enrichment, we restricted pathway enrichment analysis to single-copy human orthologs (including 1:1 and multi:1 orthologs between A. mexicanus and H. sapiens). This is consistent with methods in functional annotations overall, which rely on orthology relationships beyond 1:1 orthology (see, e.g., Hernández-Plaza et al. 2022). We note that because multiple Mexican tetra genes may map to the same human ortholog, the number of genes within a pathway that appear to be impacted in both cavefish lineages is overrepresented (i.e., different cavefish genes with deletions may map to the same human ortholog, which can give the false impression that the same gene is affected in both lineages).
Quantification of cave versus surface gene expression
Previously published RNA-seq data sets were utilized for differential gene expression: wild-type livers (Krishnan et al. 2020), postinjury hearts across three time points (Stockdale et al. 2018), and 54 hours postfertilization (hpf) eyes (Gore et al. 2018). Reads were mapped using the Amex 3.0 NCBI annotation with STAR v2.7.11b (Dobin and Gingeras 2015). We enabled –quantmode to count reads during mapping, which generates identical results to HTseq (Anders et al. 2014). We did not trim reads given that trimming is redundant when mapping involves soft-clipping (Liao and Shi 2020), a default in the STAR aligner. We used DESeq2 to normalize raw counts based on size factors, remove outliers based on Cooke's distance, perform differential expression, and run PCAs on variance stabilized counts (Love et al. 2014). All comparisons were performed with Pachón versus Río Choy, as both populations were available in all data sets. For the livers, eyes, and hearts, the significance threshold was set to an adjusted P-value < 0.05.
Associating candidate deletions with gene expression
Genotyping of the individuals used for RNA-seq is not available. Therefore, to ensure the deletion was present in the Pachón individual used for RNA-seq, we calculated Weir and Cockerham's FST using VCFtools on the lineage 2 focal deletions (Danecek et al. 2011). We filtered the data set to only include variants in Pachón that have FST = 1 compared with Río Choy. We then identified all genes with a fixed focal deletion that intersects the gene structure, 5000 bp upstream of or downstream from the start and stop site. In addition, we identified a set of control genes that did not have any evidence of structural variation (including both insertions and deletions) within the gene structure or 5000 bp upstream of or downstream from the start and stop site.
We first tested whether the likelihood that a gene is differentially expressed differs between fixed focal deletions and control deletions in each tissue using a Fisher's exact test. Additionally, we tested whether fixed focal genes are differentially expressed more frequently than expected by chance in each tissue using a hypergeometric test with the phyper() function in R (R Core Team 2025), setting lower.tail=FALSE. This calculates whether candidate genes are overrepresented among the genes that are differentially expressed between cave and surface. Differentially expressed genes that are focal genes are treated as “successes” in the test. The significance of the rate of success is based on N, the number of protein-coding genes in the genome; K, the number of differentially expressed genes; M, the number of candidate genes; and x, the number of differentially expressed genes that are focal genes (i.e., “successes”).
Data access
The Mexican tetra pangenome graph, VCF of variants present in the graph, and VCF of genotyped individuals from additional populations generated in this study are available at Zenodo (https://doi.org/10.5281/zenodo.19665971). Code for custom scripts and analysis pipelines generated in this study are available at GitHub (https://github.com/WarrenLab/minigraph-cactus-nf; https://github.com/robackem/Cavefish-SV; https://github.com/maggs-x/Amex-pangenome) and as Supplemental Code.
Competing interest statement
The authors declare no competing interests.
Acknowledgments
This research was supported by the National Science Foundation (Division of Integrative Organismal Systems: 1933076 and Division of Environmental Biology: 2316783) and the National Institutes of Health, Office of the Director (R24OD030214). In addition, the high-performance computing systems of the Minnesota Supercomputing Institute (University of Minnesota) and Hellbender (University of Missouri) enabled this computationally intensive research.
Author contributions: E.Y.R. led the project, including study design, data analysis, manuscript writing, and editing, and completed all figure design. M.X. contributed to study design, data analysis, and manuscript preparation. E.S.R. contributed to study design, data analysis, and manuscript preparation. A.W. performed the IPA analysis. R.A.C. provided technical support and manuscript review. C.G.E. contributed to manuscript review. A.C.K. and N.R. contributed to project ideation and manuscript review. S.E.M. and W.C.W. initiated project ideation, supervised the project, and contributed to study design, analyses, and manuscript preparation.
Footnotes
[1] Supplementary material [Supplemental material is available for this article.]
[2] Article published online before print. Article, supplemental material, and publication date are at https://www.genome.org/cgi/doi/10.1101/gr.281719.125.
[3] Freely available online through the Genome Research Open Access option.
References
- ↵Albalat R, Cañestro C. 2016. Evolution by gene loss. Nat Rev Genet 17: 379–391. 10.1038/nrg.2016.39
- ↵Anders S, Pyl PT, Huber W. 2014. HTSeq—a Python framework to work with high-throughput sequencing data. Bioinformatics 31: 166–169. 10.1093/bioinformatics/btu638
- ↵Andersson L, Purugganan M. 2022. Molecular genetic variation of animals and plants under domestication. Proc Natl Acad Sci 119: e2122150119. 10.1073/pnas.2122150119
- ↵Aspiras AC, Rohner N, Martineau B, Borowsky RL, Tabin CJ. 2015. Melanocortin 4 receptor mutations contribute to the adaptation of cavefish to nutrient-poor conditions. Proc Natl Acad Sci 112: 9668–9673. 10.1073/pnas.1510802112
- ↵Atukorala ADS, Bhatia V, Ratnayake R. 2019. Craniofacial skeleton of MEXICAN tetra (Astyanax mexicanus): as a bone disease model. Dev Dyn 248: 153–161. 10.1002/dvdy.4
- ↵Audano PA, Sulovari A, Graves-Lindsay TA, Cantsilieris S, Sorensen M, Welch AE, Dougherty ML, Nelson BJ, Shah A, Dutcher SK, 2019. Characterizing the major structural variant alleles of the human genome. Cell 176: 663–675.e19. 10.1016/j.cell.2018.12.019
- ↵Bailey SF, Rodrigue N, Kassen R. 2015. The effect of selection environment on the probability of parallel evolution. Mol Biol Evol 32: 1436–1448. 10.1093/molbev/msv033
- ↵Barrett RDH, Schluter D. 2008. Adaptation from standing genetic variation. Trends Ecol Evol 23: 38–44. 10.1016/j.tree.2007.09.008
- ↵Battlay P, Craig S, Putra AR, Monro K, De Silva NP, Wilson J, Bieker VC, Kabir S, Shamaya N, van Boheemen L, 2025. Rapid parallel adaptation in distinct invasions of Ambrosia artemisiifolia is driven by large-effect structural variants. Mol Biol Evol 42: msae270. 10.1093/molbev/msae270
- ↵Bayer PE, Golicz AA, Scheben A, Batley J, Edwards D. 2020. Plant pan-genomes are the new reference. Nat Plants 6: 914–920. 10.1038/s41477-020-0733-0
- ↵Behrmann-Godel J, Nolte AW, Kreiselmaier J, Berka R, Freyhof J. 2017. The first European cave fish. Curr Biol 27: R257–R258. 10.1016/j.cub.2017.02.048
- ↵Bilandžija H, Ma L, Parkhurst A, Jeffery WR. 2013. A potential benefit of albinism in Astyanax cavefish: downregulation of the oca2 gene increases tyrosine and catecholamine levels as an alternative to melanin synthesis. PLoS One 8: e80823. 10.1371/journal.pone.0080823
- ↵Bloom T, Binford G, Esposito LA, Garcia GA, Peterson I, Nishida A, Loubet-Senear K, Agnarsson I. 2014. Discovery of two new species of eyeless spiders within a single Hispaniola cave. J Arachnol 42: 148–154, 147. 10.1636/K13-84.1
- ↵Bohonowych JE, Vrana-Diaz CJ, Miller JL, McCandless SE, Strong TV. 2021. Incidence of strabismus, strabismus surgeries, and other vision conditions in Prader-Willi syndrome: data from the Global Prader-Willi Syndrome Registry. BMC Ophthalmol 21: 296. 10.1186/s12886-021-02057-4
- ↵Bowden DW, Sale M, Howard TD, Qadri A, Spray BJ, Rothschild CB, Akots G, Rich SS, Freedman BI. 1997. Linkage of genetic markers on human chromosomes 20 and 12 to NIDDM in Caucasian sib pairs with a history of diabetic nephropathy. Diabetes 46: 882–886. 10.2337/diab.46.5.882
- ↵Bradic M, Beerli P, García-de León FJ, Esquivel-Bobadilla S, Borowsky RL. 2012. Gene flow and population structure in the Mexican blind cavefish complex (Astyanax mexicanus). BMC Evol Biol 12: 9. 10.1186/1471-2148-12-9
- ↵Butler MG. 1990. Prader-Willi syndrome: current understanding of cause and diagnosis. Am J Med Genet 35: 319–332. 10.1002/ajmg.1320350306
- ↵Catanach A, Crowhurst R, Deng C, David C, Bernatchez L, Wellenreuther M. 2019. The genomic pool of standing structural variation outnumbers single nucleotide polymorphism by threefold in the marine teleost Chrysophrys auratus. Mol Ecol 28: 1210–1223. 10.1111/mec.15051
- ↵Chan YF, Marks ME, Jones FC, Villarreal G, Shapiro MD, Brady SD, Southwick AM, Absher DM, Grimwood J, Schmutz J, 2010. Adaptive evolution of pelvic reduction in sticklebacks by recurrent deletion of a Pitx1 enhancer. Science 327: 302–305. 10.1126/science.1182213
- ↵Chang Y-C, Chiu Y-F, Liu P-H, Shih K-C, Lin M-W, Sheu WH-H, Quertermous T, Curb JD, Hsiung CA, Lee W-J, 2012. Replication of genome-wide association signals of type 2 diabetes in Han Chinese in a prospective cohort. Clin Endocrinol 76: 365–372. 10.1111/j.1365-2265.2011.04175.x
- ↵Cingolani P, Platts A, Wang LL, Coon M, Nguyen T, Wang L, Land SJ, Lu X, Ruden DM. 2012a. A program for annotating and predicting the effects of single nucleotide polymorphisms, SnpEff. Fly 6: 80–92. 10.4161/fly.19695
- ↵Cingolani P, Patel VM, Coon M, Nguyen T, Land SJ, Ruden DM, Lu X. 2012b. Using Drosophila melanogaster as a model for genotoxic chemical mutational studies with a new program, SnpSift. Front Genet 3: 35. 10.3389/fgene.2012.00035
- ↵Coghill LM, Darrin Hulsey C, Chaves-Campos J, García de Leon FJ, Johnson SG. 2014. Next generation phylogeography of cave and surface Astyanax mexicanus. Mol Phylogen Evol 79: 368–374. 10.1016/j.ympev.2014.06.029
- ↵Colosimo PF, Hosemann KE, Balabhadra S, Villarreal G, Dickson M, Grimwood J, Schmutz J, Myers RM, Schluter D, Kingsley DM. 2005. Widespread parallel evolution in sticklebacks by repeated fixation of ectodysplasin alleles. Science 307: 1928–1933. 10.1126/science.1107239
- ↵Culver DC, Pipan T. 2019. The biology of caves and other subterranean habitats. Oxford University Press, Oxford, UK.
- ↵Cumer T, Boyer F, Pompanon F. 2021. Genome-wide detection of structural variations reveals new regions associated with domestication in small ruminants. Genome Biol Evol 13: evab165. 10.1093/gbe/evab165
- ↵Cutie S, Huang GN. 2021. Vertebrate cardiac regeneration: evolutionary and developmental perspectives. Cell Regen 10: 6. 10.1186/s13619-020-00068-y
- ↵Danecek P, Auton A, Abecasis G, Albers CA, Banks E, DePristo MA, Handsaker RE, Lunter G, Marth GT, Sherry ST, 2011. The variant call format and VCFtools. Bioinformatics 27: 2156–2158. 10.1093/bioinformatics/btr330
- ↵Danecek P, Bonfield JK, Liddle J, Marshall J, Ohan V, Pollard MO, Whitwham A, Keane T, McCarthy SA, Davies RM, 2021. Twelve years of SAMtools and BCFtools. GigaScience 10: giab008. 10.1093/gigascience/giab008
- ↵Darwin C. 1859. On the origin of the species. John Murray, London.
- ↵Dhakal U, Kim HS, Toomajian C. 2024. The landscape and predicted roles of structural variants in Fusarium graminearum genomes. G3 (Bethesda) 14: jkae065. 10.1093/g3journal/jkae065
- ↵Dobin A, Gingeras TR. 2015. Mapping RNA-seq reads with STAR. Curr Protoc Bioinform 51: 11.14.1–11.14.19. 10.1002/0471250953.bi1114s51
- ↵Dwivedi OP, Lehtovirta M, Hastoy B, Chandra V, Krentz NAJ, Kleiner S, Jain D, Richard A-M, Abaitua F, Beer NL, 2019. Loss of ZnT8 function protects against diabetes by enhanced insulin secretion. Nat Genet 51: 1596–1606. 10.1038/s41588-019-0513-9
- ↵Edwards SV, Fang B, Khost D, Kolyfetis GE, Cheek RG, DeRaad DA, Chen N, Fitzpatrick JW, McCormack JE, Funk WC, 2025. Multispecies pangenomes reveal a pervasive influence of population size on structural variation. Science 390: eadw1931. 10.1126/science.adw1931
- ↵Eizenga JM, Novak AM, Sibbesen JA, Heumos S, Ghaffaari A, Hickey G, Chang X, Seaman JD, Rounthwaite R, Ebler J, 2020. Pangenome graphs. Annu Rev Genomics Hum Genet 21: 139–162. 10.1146/annurev-genom-120219-080406
- ↵Elipot Y, Hinaux H, Callebert J, Rétaux S. 2013. Evolutionary shift from fighting to foraging in blind cavefish through changes in the serotonin network. Curr Biol 23: 1–10. 10.1016/j.cub.2012.10.044
- ↵Elliott WR. 2018. The Astyanax caves of Mexico: cavefishes of Tamaulipas, San Luis Potosí, and Guerrero. AMCS Bulletin 26: 1–325.
- ↵Emms DM, Kelly S. 2019. OrthoFinder: phylogenetic orthology inference for comparative genomics. Genome Biol 20: 238. 10.1186/s13059-019-1832-y
- ↵Fang B, Edwards SV. 2024. Fitness consequences of structural variation inferred from a house Finch pangenome. Proc Natl Acad Sci 121: e2409943121. 10.1073/pnas.2409943121
- ↵Filipek-Górniok B, Carlsson P, Haitina T, Habicher J, Ledin J, Kjellén L. 2015. The Ndst gene family in zebrafish: role of Ndst1b in pharyngeal arch formation. PLoS One 10: e0119040. 10.1371/journal.pone.0119040
- ↵Flynn JM, Hubley R, Goubert C, Rosen J, Clark AG, Feschotte C, Smit AF. 2020. RepeatModeler2 for automated genomic discovery of transposable element families. Proc Natl Acad Sci 117: 9451–9457. 10.1073/pnas.1921046117
- ↵Furuta M, Yano H, Zhou A, Rouillé Y, Holst JJ, Carroll R, Ravazzola M, Orci L, Furuta H, Steiner DF. 1997. Defective prohormone processing and altered pancreatic islet morphology in mice lacking active SPC2. Proc Natl Acad Sci 94: 6646–6651. 10.1073/pnas.94.13.6646
- ↵Furuta M, Carroll R, Martin S, Swift HH, Ravazzola M, Orci L, Steiner DF. 1998. Incomplete processing of proinsulin to insulin accompanied by elevation of Des-31,32 proinsulin intermediates in islets of mice lacking active PC2*. J Biol Chem 273: 3431–3437. 10.1074/jbc.273.6.3431
- ↵Furuta M, Zhou A, Webb G, Carroll R, Ravazzola M, Orci L, Steiner DF. 2001. Severe defect in proglucagon processing in islet A-cells of prohormone convertase 2 null mice*. J Biol Chem 276: 27197–27202. 10.1074/jbc.M103362200
- ↵Gabreëls BATF, Swaab DF, de Kleijn DPV, Seidah NG, Van de Loo J-W, Van de Ven WJM, Martens GJM, van Leeuwen FW. 1998. Attenuation of the polypeptide 7B2, prohormone convertase PC2, and vasopressin in the hypothalamus of some Prader-Willi patients: indications for a processing defect. J Clin Endocrinol Metab 83: 591–599. 10.1210/jcem.83.2.4542
- ↵Garduño-Sánchez M, Hernández-Lozano J, Moran RL, Miranda-Gamboa R, Gross JB, Rohner N, Elliott WR, Miller J, Lozano-Vilano L, McGaugh SE, 2023. Phylogeographic relationships and morphological evolution between cave and surface Astyanax mexicanus populations (De Filippi 1853) (Actinopterygii, Characidae). Mol Ecol 32: 5626–5644. 10.1111/mec.17128
- ↵Goel M, Sun H, Jiao W-B, Schneeberger K. 2019. SyRI: finding genomic rearrangements and local sequence differences from whole-genome assemblies. Genome Biol 20: 277. 10.1186/s13059-019-1911-0
- ↵Golicz AA, Bayer PE, Barker GC, Edger PP, Kim H, Martinez PA, Chan CKK, Severn-Ellis A, McCombie WR, Parkin IAP, 2016. The pangenome of an agronomically important crop plant Brassica oleracea. Nat Comm 7: 13390. 10.1038/ncomms13390
- ↵Gompel N, Prud'homme B. 2009. The causes of repeated genetic evolution. Dev Biol 332: 36–47. 10.1016/j.ydbio.2009.04.040
- ↵Gore AV, Tomins KA, Iben J, Ma L, Castranova D, Davis AE, Parkhurst A, Jeffery WR, Weinstein BM. 2018. An epigenetic mechanism for cavefish eye degeneration. Nat Ecol Evol 2: 1155–1160. 10.1038/s41559-018-0569-4
- ↵Gozashti L, Harringmeyer OS, Kirby C, Sudmant P, Kautt AF, Hoekstra HE. 2026. Pangenome graphs reveal the extent and complexity of genetic variation in North America's most abundant mammal. bioRxiv 10.64898/2026.01.27.701785
- ↵Greenway R, Barts N, Henpita C, Brown AP, Arias Rodriguez L, Rodríguez Peña CM, Arndt S, Lau GY, Murphy MP, Wu L, 2020. Convergent evolution of conserved mitochondrial pathways underlies repeated adaptation to extreme environments. Proc Natl Acad Sci 117: 16424–16430. 10.1073/pnas.2004223117
- ↵Grobe K, Inatani M, Pallerla SR, Castagnola J, Yamaguchi Y, Esko JD. 2005. Cerebral hypoplasia and craniofacial defects in mice lacking heparan sulfate Ndst1 gene function. Development 132: 3777–3786. 10.1242/dev.01935
- ↵Gross JB, Borowsky R, Tabin CJ. 2009. A novel role for Mc1r in the parallel evolution of depigmentation in independent populations of the cavefish Astyanax mexicanus. PLoS Genet 5: e1000326. 10.1371/journal.pgen.1000326
- ↵Groza C, Schwendinger-Schreck C, Cheung WA, Farrow EG, Thiffault I, Lake J, Rizzo WB, Evrony G, Curran T, Bourque G, 2024. Pangenome graphs improve the analysis of structural variants in rare genetic diseases. Nat Comm 15: 657. 10.1038/s41467-024-44980-2
- ↵Hämälä T, Wafula EK, Guiltinan MJ, Ralph PE, Depamphilis CW, Tiffin P. 2021. Genomic structural variants constrain and facilitate adaptation in natural populations of Theobroma cacao, the chocolate tree. Proc Natl Acad Sci 118: e2102914118. 10.1073/pnas.2102914118
- ↵Herman A, Brandvain Y, Weagley J, Jeffery WR, Keene AC, Kono TJY, Bilandžija H, Borowsky R, Espinasa L, O'Quin K, 2018. The role of gene flow in rapid and repeated evolution of cave-related traits in Mexican tetra, Astyanax mexicanus. Mol Ecol 27: 4397–4416. 10.1111/mec.14877
- ↵Hernández-Lozano J, Garita-Alvarado CA, Munguía-Steyer R, Garduño-Sánchez MA, Ornelas-García CP. 2024. Parallel phenotypic evolution of two independent cavefish lineages of Astyanax mexicanus (De Filippi, 1854) (Characiformes: Characidae). Biol J Linn Soc 145: blae059. 10.1093/biolinnean/blae059
- ↵Hernández-Plaza A, Szklarczyk D, Botas J, Cantalapiedra Carlos P, Giner-Lamia J, Mende DR, Kirsch R, Rattei T, Letunic I, Jensen LJ, 2022. eggNOG 6.0: enabling comparative genomics across 12535 organisms. Nucleic Acids Res 51: D389–D394. 10.1093/nar/gkac1022
- ↵Hickey G, Heller D, Monlong J, Sibbesen JA, Sirén J, Eizenga J, Dawson ET, Garrison E, Novak AM, Paten B. 2020. Genotyping structural variants in pangenome graphs using the vg toolkit. Genome Biol 21: 35. 10.1186/s13059-020-1941-7
- ↵Hickey G, Monlong J, Ebler J, Novak AM, Eizenga JM, Gao Y, Human Pangenome Reference Consortium; Marschall T, Li H, Paten B. 2024. Pangenome graph construction from genome alignments with Minigraph-Cactus. Nat Biotechnol 42: 663–673. 10.1038/s41587-023-01793-w
- ↵Hirsch CN, Foerster JM, Johnson JM, Sekhon RS, Muttoni G, Vaillancourt B, Peñagaricano F, Lindquist E, Pedraza MA, Barry K, 2014. Insights into the maize pan-genome and pan-transcriptome. Plant Cell 26: 121–135. 10.1105/tpc.113.119982
- ↵Ho SS, Urban AE, Mills RE. 2020. Structural variation in the sequencing era. Nat Rev Genet 21: 171–189. 10.1038/s41576-019-0180-9
- ↵Huddleston J, Eichler EE. 2016. An incomplete understanding of human genetic variation. Genetics 202: 1251–1254. 10.1534/genetics.115.180539
- ↵Huddleston J, Chaisson MJ, Steinberg KM, Warren W, Hoekzema K, Gordon D, Graves-Lindsay TA, Munson KM, Kronenberg ZN, Vives L, 2017. Discovery and genotyping of structural variation from long-read haploid genome sequence data. Genome Res 27: 677–685. 10.1101/gr.214007.116
- ↵Imarazene B, Du K, Beille S, Jouanno E, Feron R, Pan Q, Torres-Paz J, Lopez-Roques C, Castinel A, Gil L, 2021. A supernumerary B-sex chromosome drives male sex determination in the Pachon cavefish, Astyanax mexicanus. Curr Biol 31: 4800–4809.e9. 10.1016/j.cub.2021.08.030
- ↵Jiang Y-F, Wang S, Wang C-L, Xu R-H, Wang W-W, Jiang Y, Wang M-S, Jiang L, Dai L-H, Wang J-R, 2023. Pangenome obtained by long-read sequencing of 11 genomes reveal hidden functional structural variants in pigs. iScience 26: 106119. 10.1016/j.isci.2023.106119
- ↵Jones FC, Grabherr MG, Chan YF, Russell P, Mauceli E, Johnson J, Swofford R, Pirun M, Zody MC, White S, 2012. The genomic basis of adaptive evolution in threespine sticklebacks. Nature 484: 55–61. 10.1038/nature10944
- ↵Kaur H, Shannon LM, Samac DA. 2024. A stepwise guide for pangenome development in crop plants: an alfalfa (Medicago sativa) case study. BMC Genomics 25: 1022. 10.1186/s12864-024-10931-w
- ↵Kern AD, Schrider DR. 2016. Discoal: flexible coalescent simulations with selection. Bioinformatics 32: 3839–3841. 10.1093/bioinformatics/btw556
- ↵Kern AD, Schrider DR. 2018. diplos/HIC: an updated approach to classifying selective sweeps. G3 (Bethesda) 8: 1959–1970. 10.1534/g3.118.200262
- ↵Klaus S, Mendoza JC, Liew JH, Plath M, Meier R, Yeo DC. 2013. Rapid evolution of troglomorphic characters suggests selection rather than neutral mutation as a driver of eye reduction in cave crabs. Biol Lett 9: 20121098. 10.1098/rsbl.2012.1098
- ↵Kosugi S, Momozawa Y, Liu X, Terao C, Kubo M, Kamatani Y. 2019. Comprehensive evaluation of structural variation detection algorithms for whole genome sequencing. Genome Biol 20: 117. 10.1186/s13059-019-1720-5
- ↵Kowalko JE, Rohner N, Rompani SB, Peterson BK, Linden TA, Yoshizawa M, Kay EH, Weber J, Hoekstra HE, Jeffery WR, 2013. Loss of schooling behavior in cavefish through sight-dependent and sight-independent mechanisms. Curr Biol 23: 1874–1883. 10.1016/j.cub.2013.07.056
- ↵Krämer A, Green J, Pollard JJr, Tugendreich S. 2014. Causal analysis approaches in ingenuity pathway analysis. Bioinformatics 30: 523–530. 10.1093/bioinformatics/btt703
- ↵Krishnan J, Rohner N. 2017. Cavefish and the basis for eye loss. Philos Trans R Soc Lond B Biol Sci 372: 20150487. 10.1098/rstb.2015.0487
- ↵Krishnan J, Persons JL, Peuß R, Hassan H, Kenzior A, Xiong S, Olsen L, Maldonado E, Kowalko JE, Rohner N. 2020. Comparative transcriptome analysis of wild and lab populations of Astyanax mexicanus uncovers differential effects of environment and morphotype on gene expression. J Exp Zool B Mol Dev Evol 334: 530–539. 10.1002/jez.b.22933
- ↵Lefébure T, Morvan C, Malard F, François C, Konecny-Dupré L, Guéguen L, Weiss-Gayet M, Seguin-Orlando A, Ermini L, Sarkissian C, 2017. Less effective selection leads to larger genomes. Genome Res 27: 1016–1028. 10.1101/gr.212589.116
- ↵Leys R, Cooper SJ, Strecker U, Wilkens H. 2005. Regressive evolution of an eye pigment gene in independently evolved eyeless subterranean diving beetles. Biol Lett 1: 496–499. 10.1098/rsbl.2005.0358
- ↵Li W-D, Dong C, Li D, Zhao H, Price RA. 2004. An obesity-related locus in chromosome region 12q23-24. Diabetes 53: 812–820. 10.2337/diabetes.53.3.812
- ↵Li R, Gong M, Zhang X, Wang F, Liu Z, Zhang L, Yang Q, Xu Y, Xu M, Zhang H, 2023. A sheep pangenome reveals the spectrum of structural variations and their effects on tail phenotypes. Genome Res 33: 463–477. 10.1101/gr.277372.12
- ↵Liang X, Duan Q, Li B, Wang Y, Bu Y, Zhang Y, Kuang Z, Mao L, An X, Wang H, 2024. Genomic structural variation contributes to evolved changes in gene expression in high-altitude Tibetan sheep. Proc Natl Acad Sci 121: e2322291121. 10.1073/pnas.2322291121
- ↵Liao Y, Shi W. 2020. Read trimming is not required for mapping and quantification of RNA-seq reads at the gene level. NAR Genom Bioinform 2: lqaa068. 10.1093/nargab/lqaa068
- ↵Liu X, Liu W, Lenstra JA, Zheng Z, Wu X, Yang J, Li B, Yang Y, Qiu Q, Liu H, 2023. Evolutionary origin of genomic structural variations in domestic yaks. Nat Commun 14: 5617. 10.1038/s41467-023-41220-x
- ↵Long E, Evans C, Chaston J, Udall JA. 2018. Genomic structural variations within five continental populations of Drosophila melanogaster. G3 (Bethesda) 8: 3247–3253. 10.1534/g3.118.200631
- ↵Lopes I, Altab G, Raina P, de Magalhães JP. 2021. Gene size matters: an analysis of gene length in the human genome. Front Genet 12: 559998. 10.3389/fgene.2021.559998
- ↵Love MI, Huber W, Anders S. 2014. Moderated estimation of fold change and dispersion for RNA-seq data with DESeq2. Genome Biol 15: 550. 10.1186/s13059-014-0550-8
- ↵Mahmoud M, Gobet N, Cruz-Dávalos DI, Mounier N, Dessimoz C, Sedlazeck FJ. 2019. Structural variant calling: the long and the short of it. Genome Biol 20: 246. 10.1186/s13059-019-1828-7
- ↵McCracken KG, Barger CP, Bulgarella M, Johnson KP, Sonsthagen SA, Trucco J, Valqui TH, Wilson RE, Winker K, Sorenson MD. 2009. Parallel evolution in the major haemoglobin genes of eight species of Andean waterfowl. Mol Ecol 18: 3992–4005. 10.1111/j.1365-294X.2009.04352.x
- ↵Medley JK, Persons J, Biswas T, Olsen L, Peuß R, Krishnan J, Xiong S, Rohner N. 2022. The metabolome of Mexican cavefish shows a convergent signature highlighting sugar, antioxidant, and ageing-related metabolites. eLife 11: e74539. 10.7554/eLife.74539
- ↵Mitchell RW, Russell WH, Elliott WR. 1977. Mexican eyeless Characin fishes, genus Astyanax: environment, distribution, and evolution. Texas Tech Press, Lubbock, TX.
- ↵Monroe JG, McKay JK, Weigel D, Flood PJ. 2021. The population genomics of adaptive loss of function. Heredity (Edinb) 126: 383–395. 10.1038/s41437-021-00403-2
- ↵Montenegro JD, Golicz AA, Bayer PE, Hurgobin B, Lee H, Chan C-KK, Visendi P, Lai K, Doležel J, Batley J, 2017. The pangenome of hexaploid bread wheat. Plant J 90: 1007–1013. 10.1111/tpj.13515
- ↵Moran RL, Richards EJ, Ornelas-García CP, Gross JB, Donny A, Wiese J, Keene AC, Kowalko JE, Rohner N, McGaugh SE. 2023. Selection-driven trait loss in independently evolved cavefish populations. Nat Comm 14: 2557. 10.1038/s41467-023-37909-8
- ↵Morris SC. 2003. Life's solution: inevitable humans in a lonely universe. Cambridge University Press, Cambridge, UK.
- ↵Murray AW. 2020. Can gene-inactivating mutations lead to evolutionary novelty? Curr Biol 30: R465–R471. 10.1016/j.cub.2020.03.072
- ↵Niemiller ML, Fitzpatrick BM, Miller BT. 2008. Recent divergence with gene flow in Tennessee cave salamanders (Plethodontidae: Gyrinophilus) inferred from gene genealogies. Mol Ecol 17: 2258–2275. 10.1111/j.1365-294X.2008.03750.x
- ↵O'Gorman M, Thakur S, Imrie G, Moran RL, Choy S, Sifuentes-Romero I, Bilandžija H, Renner KJ, Duboué E, Rohner N, 2021. Pleiotropic function of the oca2 gene underlies the evolution of sleep loss and albinism in cavefish. Curr Biol 31: 3694–3701.e4. 10.1016/j.cub.2021.06.077
- ↵Ornelas-García CP, Domínguez-Domínguez O, Doadrio I. 2008. Evolutionary history of the fish genus Astyanax Baird & Girard (1854) (Actinopterygii, Characidae) in Mesoamerica reveals multiple morphological homoplasies. BMC Evol Biol 8: 340. 10.1186/1471-2148-8-340
- ↵Ponnimbaduge Perera P, Perez Guerra D, Riddle MR. 2023. The Mexican tetra, Astyanax mexicanus, as a model system in cell and developmental biology. Annu Rev Cell Dev Biol 39: 23–44. 10.1146/annurev-cellbio-012023-014003
- ↵Powers AK, Davis EM, Kaplan SA, Gross JB. 2017. Cranial asymmetry arises later in the life history of the blind Mexican cavefish, Astyanax mexicanus. PLoS One 12: e0177419. 10.1371/journal.pone.0177419
- ↵Powers AK, Boggs TE, Gross JB. 2018. Canal neuromast position prefigures developmental patterning of the suborbital bone series in Astyanax cave- and surface-dwelling fish. Dev Biol 441: 252–261. 10.1016/j.ydbio.2018.04.001
- ↵Protas ME, Hersey C, Kochanek D, Zhou Y, Wilkens H, Jeffery WR, Zon LI, Borowsky R, Tabin CJ. 2006. Genetic analysis of cavefish reveals molecular convergence in the evolution of albinism. Nat Genet 38: 107–111. 10.1038/ng1700
- ↵Protas M, Conrad M, Gross JB, Tabin C, Borowsky R. 2007. Regressive evolution in the Mexican cave tetra, Astyanax mexicanus. Curr Biol 17: 452–454. 10.1016/j.cub.2007.01.051
- ↵Protas M, Tabansky I, Conrad M, Gross JB, Vidal O, Tabin CJ, Borowsky R. 2008. Multi-trait evolution in a cave fish, Astyanax mexicanus. Evol Dev 10: 196–209. 10.1111/j.1525-142X.2008.00227.x
- ↵Quah FX, Almeida MV, Blumer M, Yuan CU, Fischer B, See K, Jackson B, Zatha R, Rusuwa B, Turner GF, 2025. Lake Malawi cichlid pangenome graph reveals extensive structural variation driven by transposable elements. Genome Res 35: 1094–1107. 10.1101/gr.279674.124
- ↵Quinlan AR. 2014. BEDTools: the Swiss-army tool for genome feature analysis. Curr Protoc Bioinform 47: 11.12.1–11.12.34. 10.1002/0471250953.bi1112s47
- ↵R Core Team. 2025. R: a language and environment for statistical computing. R Foundation for Statistical Computing, Vienna. https://www.R-project.org/.
- ↵Revelli J-P, Smith D, Allen J, Jeter-Jones S, Shadoan MK, Desai U, Schneider M, van Sligtenhorst I, Kirkpatrick L, Platt KA, 2011. Profound obesity secondary to hyperphagia in mice lacking kinase suppressor of Ras 2. Obesity 19: 1010–1018. 10.1038/oby.2010.282
- ↵Rice ES, Alberdi A, Alfieri J, Athrey G, Balacco JR, Bardou P, Blackmon H, Charles M, Cheng HH, Fedrigo O, 2023. A pangenome graph reference of 30 chicken genomes allows genotyping of large and complex structural variants. BMC Biol 21: 267. 10.1186/s12915-023-01758-0
- ↵Riddle MR, Aspiras AC, Gaudenz K, Peuß R, Sung JY, Martineau B, Peavey M, Box AC, Tabin JA, McGaugh S, 2018. Insulin resistance in cavefish as an adaptation to a nutrient-limited environment. Nature 555: 647–651. 10.1038/nature26136
- ↵Roback EY, Ferrufino E, Moran RL, Shennard D, Mulliniks C, Gallop J, Weagley J, Miller J, Fily Y, Ornelas-García CP, 2025. Population genomics of premature termination codons in cavefish with substantial trait loss. Mol Biol Evol 42: msaf012. 10.1093/molbev/msaf012
- ↵Ruggieri AA, Livraghi L, Lewis JJ, Evans E, Cicconardi F, Hebberecht L, Ortiz-Ruiz Y, Montgomery SH, Ghezzi A, Rodriguez-Martinez JA, 2022. A butterfly pan-genome reveals that a large amount of structural variation underlies the evolution of chromatin accessibility. Genome Res 32: 1862–1875. 10.1101/gr.276839.122
- ↵Saunders MA, Good JM, Lawrence EC, Ferrell RE, Li W-H, Nachman MW. 2006. Human adaptive evolution at Myostatin (GDF8), a regulator of muscle growth. Am J Hum Genet 79: 1089–1097. 10.1086/509707
- ↵Schilthuizen M, Cabanban A, Haase M. 2005. Possible speciation with gene flow in tropical cave snails. J Zool Syst Evol Res 43: 133–138. 10.1111/j.1439-0469.2004.00289.x
- ↵Seabold S, Perktold J. 2010. Statsmodels: econometric and statistical modeling with Python. SciPy 7: 92–96. 10.25080/Majora-92bf1922-011
- ↵Secomandi S, Gallo GR, Sozzoni M, Iannucci A, Galati E, Abueg L, Balacco J, Caprioli M, Chow W, Ciofi C, 2023. A chromosome-level reference genome and pangenome for barn swallow population genomics. Cell Rep 42: 111992. 10.1016/j.celrep.2023.111992
- ↵Sedlazeck FJ, Lee H, Darby CA, Schatz MC. 2018. Piercing the dark matter: bioinformatics of long-range sequencing and mapping. Nat Rev Genet 19: 329–346. 10.1038/s41576-018-0003-4
- ↵Sharma V, Hecker N, Roscito JG, Foerster L, Langer BE, Hiller M. 2018. A genomics approach reveals insights into the importance of gene losses for mammalian adaptations. Nat Comm 9: 1215. 10.1038/s41467-018-03667-1
- ↵Sirén J, Monlong J, Chang X, Novak AM, Eizenga JM, Markello C, Sibbesen JA, Hickey G, Chang P-C, Carroll A, 2021. Pangenomics enables genotyping of known structural variants in 5202 diverse genomes. Science 374: abg8871. 10.1126/science.abg8871
- ↵Stahl BA, Jaggard JB, Chin JSR, Kowalko JE, Keene AC, Duboué ER. 2019. Manipulation of gene function in Mexican cavefish. J Vis Exp (146). 10.3791/59093
- ↵Stockdale WT, Lemieux ME, Killen AC, Zhao J, Hu Z, Riepsaame J, Hamilton N, Kudoh T, Riley PR, van Aerle R, 2018. Heart regeneration in the Mexican cavefish. Cell Rep 25: 1997–2007.e7. 10.1016/j.celrep.2018.10.072
- ↵Storz JF. 2016. Causes of molecular convergence and parallelism in protein evolution. Nat Rev Genet 17: 239–250. 10.1038/nrg.2016.11
- ↵Sudmant PH, Rausch T, Gardner EJ, Handsaker RE, Abyzov A, Huddleston J, Zhang Y, Ye K, Jun G, Hsi-Yang Fritz M, 2015. An integrated map of structural variation in 2,504 human genomes. Nature 526: 75–81. 10.1038/nature15394
- ↵Tarailo-Graovac M, Chen N. 2009. Using RepeatMasker to identify repetitive elements in genomic sequences. Curr Protoc Bioinformatics Chapter 4: 4.10.1–4.10.14. 10.1002/0471250953.bi0410s25
- ↵Tettelin H, Masignani V, Cieslewicz MJ, Donati C, Medini D, Ward NL, Angiuoli SV, Crabtree J, Jones AL, Durkin AS, 2005. Genome analysis of multiple pathogenic isolates of Streptococcus agalactiae: implications for the microbial pan-genome. Proc Natl Acad Sci 102: 13950–13955. 10.1073/pnas.0506758102
- ↵Van der Auwera GA, O'Connor BD. 2020. Genomics in the cloud: using Docker, GATK, and WDL in Terra. O'Reilly Media, Boston.
- ↵Warren WC, Rice ES, X M, Roback E, Keene A, Martin F, Ogeh D, Haggerty L, Carroll RA, McGaugh S, 2024. Astyanax mexicanus surface and cavefish chromosome-scale assemblies for trait variation discovery. G3 (Bethesda) 14: jkae103. 10.1093/g3journal/jkae103
- ↵Wei B, Liu H, Liu X, Xiao Q, Wang Y, Zhang J, Hu Y, Liu Y, Yu G, Huang Y. 2016. Genome-wide characterization of non-reference transposons in crops suggests non-random insertion. BMC Genomics 17: 536. 10.1186/s12864-016-2847-3
- ↵Wiese J, Richards E, Kowalko JE, McGaugh SE. 2024. Quantitative trait loci concentrate in specific regions of the Mexican cavefish genome and reveal key candidate genes for cave-associated evolution. J Hered 116: 89–100. 10.1093/jhered/esae040
- ↵Wilkens H. 1988. Evolution and genetics of epigean and cave Astyanax fasciatus (Characidae, Pisces): support for the neutral mutation theory. In Evolutionary biology (ed. Hecht MK, Wallace B), Vol. 23, pp. 271–367. Springer, Boston.
- ↵Williams LM, Oleksiak MF. 2011. Ecologically and evolutionarily important SNPs identified in natural populations. Mol Biol Evol 28: 1817–1826. 10.1093/molbev/msr004
- ↵Wilson EJ, Tobler M, Riesch R, Martínez-García L, García-De León FJ. 2021. Natural history and trophic ecology of three populations of the Mexican cavefish, Astyanax mexicanus. Environ Biol Fishes 104: 1461–1474. 10.1007/s10641-021-01163-y
- ↵Xie KT, Wang G, Thompson AC, Wucherpfennig JI, Reimchen TE, MacColl ADC, Schluter D, Bell MA, Vasquez KM, Kingsley DM. 2019. DNA fragility in the parallel evolution of pelvic reduction in stickleback fish. Science 363: 81–84. 10.1126/science.aan1425
- ↵Xiong S, Krishnan J, Peuß R, Rohner N. 2018. Early adipogenesis contributes to excess fat accumulation in cave populations of Astyanax mexicanus. Dev Biol 441: 297–304. 10.1016/j.ydbio.2018.06.003
- ↵Xiong S, Wang W, Kenzior A, Olsen L, Krishnan J, Persons J, Medley K, Peuß R, Wang Y, Chen S, 2022. Enhanced lipogenesis through Pparγ helps cavefish adapt to food scarcity. Curr Biol 32: 2272–2280.e6. 10.1016/j.cub.2022.03.038
- ↵Xu YC, Guo YL. 2020. Less is more, natural loss-of-function mutation is a strategy for adaptation. Plant Commun 1: 100103. 10.1016/j.xplc.2020.100103
- ↵Yamamoto Y, Espinasa L, Stock DW, Jeffery WR. 2003. Development and evolution of craniofacial patterning is mediated by eye-dependent and -independent processes in the cavefish Astyanax. Evol Dev 5: 435–446. 10.1046/j.1525-142X.2003.03050.x
- ↵Yamamoto Y, Stock DW, Jeffery WR. 2004. Hedgehog signalling controls eye degeneration in blind cavefish. Nature 431: 844–847. 10.1038/nature02864
- ↵Yang J, Chen X, Bai J, Fang D, Qiu Y, Jiang W, Yuan H, Bian C, Lu J, He S, 2016. The Sinocyclocheilus cavefish genome provides insights into cave adaptation. BMC Biol 14: 1. 10.1186/s12915-015-0223-4
- ↵Yang J, Wang D-F, Huang J-H, Zhu Q-H, Luo L-Y, Lu R, Xie X-L, Salehian-Dehkordi H, Esmailizadeh A, Liu GE, 2024. Structural variant landscapes reveal convergent signatures of evolution in sheep and goats. Genome Biol 25: 148. 10.1186/s13059-024-03288-6
- ↵Yeaman S, Gerstein AC, Hodgins KA, Whitlock MC. 2018. Quantifying how constraints limit the diversity of viable routes to adaptation. PLoS Genet 14: e1007717. 10.1371/journal.pgen.1007717
- ↵Yoshizawa M, Hixon E, Jeffery WR. 2018. Neural crest transplantation reveals key roles in the evolution of cavefish development. Integr Comp Biol 58: 411–420. 10.1093/icb/icy006
- ↵Zhao X, Collins RL, Lee W-P, Weber AM, Jun Y, Zhu Q, Weisburd B, Huang Y, Audano PA, Wang H, 2021. Expectations and blind spots for structural variation detection from long-read assemblies and short-read genome sequencing technologies. Am J Hum Genet 108: 919–928. 10.1016/j.ajhg.2021.03.014
- ↵Zheng GX, Lau BT, Schnall-Levin M, Jarosz M, Bell JM, Hindson CM, Kyriazopoulou-Panagiotopoulou S, Masquelier DA, Merrill L, Terry JM, 2016. Haplotyping germline and cancer genomes with high-throughput linked-read sequencing. Nat Biotechnol 34: 303–311. 10.1038/nbt.3432
- ↵Zhou Y, Zhang Z, Bao Z, Li H, Lyu Y, Zan Y, Wu Y, Cheng L, Fang Y, Wu K, 2022. Graph pangenome captures missing heritability and empowers tomato breeding. Nature 606: 527–534. 10.1038/s41586-022-04808-9