Figure 6.
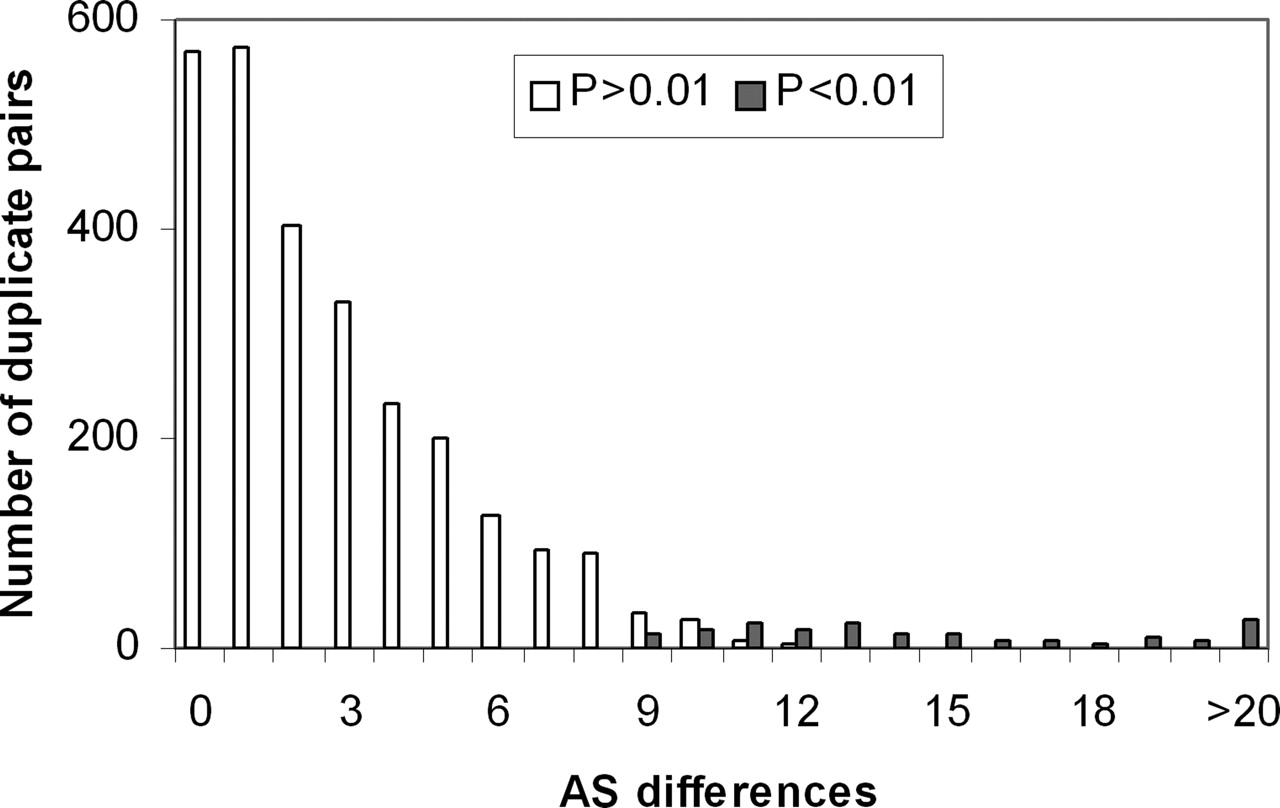
The distribution of the number of AS form differences in all duplicate pairs. P-values for asymmetric AS evolution between duplicates <0.01 (black bars) and >0.01 (white bars) are shown.
The distribution of the number of AS form differences in all duplicate pairs. P-values for asymmetric AS evolution between duplicates <0.01 (black bars) and >0.01 (white bars) are shown.