Abstract
Cell lines are invaluable tools for biomedical and evolutionary studies, but their genomic stability over time is often assumed rather than systematically assessed. In this study, we investigate the dynamics of genomic instability and structural rearrangements across multiple batches of a Nomascus siki cell line using a combination of single-cell template strand sequencing (Strand-seq), whole-genome sequencing (WGS), and fluorescence in situ hybridization (FISH). We identify 22 shared inversions in all the Strand-sequenced batches, confirming a common clonal origin. However, we detect additional large-scale rearrangements in all the batches, including trisomy of Chromosome 14 and the formation of isochromosomes of the same chromosome (iso-q and iso-p), leading to the rise of distinct subclonal populations. These rearrangements show evidence of clonal expansion, suggesting a proliferative advantage under in vitro conditions. From an evolutionary perspective, the gibbon genome is known for its exceptional level of chromosomal reshuffling, and this inherent plasticity may have contributed to the cell line's sensitivity to culture-induced structural changes. Despite extensive structural variation, the cell line remains stable at the nucleotide level, with ∼99% of SNPs shared across all batches. Our results illustrate how cell culture can recapitulate aspects of karyotypic evolution and underscore the need for regular genomic surveillance, particularly in long-term cultures. Furthermore, this study demonstrates the power of combining Strand-seq and cytogenetic approaches to detect both balanced and unbalanced rearrangements, especially those present in subclonal populations that would be missed by standard WGS.
Since their establishment, cell lines have played a central role in biomedical research. Their ease of maintenance and manipulation, and virtually unlimited proliferative potential, makes them a powerful alternative to in vivo testing across a wide range of applications.
Although immortalized cell lines are widely used in research, their genomic integrity is often taken for granted. Accumulating evidence suggests such cell lines to be prone to significant chromosomal instability, yet the extent and nature of such instability, particularly in long-term cultures, remain poorly characterized (He et al. 2023; Wang et al. 2025). Although the precise causes of chromosomal instability are not fully understood, several contributing factors have been proposed, including fluctuations in CO2 levels or suboptimal temperature regulation (He et al. 2023). Epstein–Barr virus–transformed cell lines, in particular, often develop aneuploidies, which may trigger further genomic instability and structural changes (Lacoste et al. 2010; Frattini et al. 2015; Volleth et al. 2020). Structural alterations ranging from aneuploidies to subtle duplications and deletions can progressively reshape the karyotype of a cell line, potentially masking or mimicking naturally occurring genomic rearrangements. Some of these changes can provide a growth advantage and become dominant in culture (Frattini et al. 2015; Naumann et al. 2018; He et al. 2023). This issue is especially critical in comparative genomics and evolutionary studies, in which artifactual rearrangements may be misinterpreted as species-specific traits (Roschke et al. 2002; Banerjee et al. 2022; He et al. 2023; Yoo et al. 2025).
From an evolutionary perspective, chromosomal rearrangements are relatively rare in primate genomes. An exception to this rule is found within the lesser apes, or gibbons, whose genome evolution has been uniquely shaped by recurrent large-scale structural changes. Gibbons, comprising four genera—Hoolock, Hylobates, Nomascus, and Symphalangus—display remarkable karyotypic diversity, making them the most chromosomally rearranged group among extant apes (Carbone et al. 2006, 2014; Fan et al. 2017; Nie et al. 2018).
Within the genus Nomascus (2n = 52), seven species are recognized, including Nomascus concolor (western black-crested gibbon), Nomascus gabriellae (yellow-cheeked gibbon), Nomascus hainanus (Hainan gibbon), Nomascus leucogenys (northern white-cheeked gibbon), Nomascus nasutus (eastern black-crested gibbon), Nomascus siki (southern white-cheeked gibbon), and Nomascus annamensis (northern buffed-cheeked gibbon) (Roos and Geissmann 2001; Brandon-Jones et al. 2004; Thinh et al. 2010). Species classification has relied on a combination of morphological and karyotypic features. For instance, three of the aforementioned species can be cytogenetically distinguished by two distinctive chromosomal rearrangements: (1) a balanced reciprocal translocation between Chromosomes 1 and 22, resulting in a shorter Chromosome 1 (1b) and a longer Chromosome 22 (22b), instead of the wild-type 1a and 22a Chromosomes, and (2) a pericentric inversion on Chromosome 7 yielding a Chromosome 7b distinguishable from the 7a. Notably, these rearrangements are species-specific: N. leucogenys carries exclusively the pericentric inversion on Chr 7; N. gabriellae displays only the t(1;22); whereas N. siki carries both of the rearrangements (Hirai et al. 2007; Nie et al. 2018).
In this study, we investigate chromosomal instability progression in a lymphoblastoid cell line derived from N. siki using both single-cell Strand-seq and whole-genome sequencing (WGS), along with molecular cytogenetic assays. This integrated approach allows us to trace the temporal accumulation of structural chromosomal rearrangements, as well as single-nucleotide variants, highlighting the extent to which chromosomal instability can reshape the genomic architecture of a cell line during prolonged in vitro culture.
Results
Cell cultures
The first batch of the N. siki cell line, named batch1 (Fig. 1A), was thawed from a stock at the University of Bari (Uniba, Italy), kept in culture for 21 days (9 passages) and used to prepare strand sequencing (Strand-seq) libraries for 96 cells, metaphase preparation (prep1A) for FISH analysis (Mercuri et al. 2022), and genomic DNA for WGS, as shown in Figure 1B and Supplemental Table S1.
Geographical origin and experimental workflow for the different batches of the Nomascus siki cell line analyzed in the present study. As shown in panel A, all three batches originated from the University of Cambridge: batch1 (purple) was directly transferred to Uniba (Italy); batch2 (green) and batch3 (red) were first shipped to UTAD (Portugal) and subsequently to Uniba for further processing and analysis. Panel B illustrates the processing of all the batches at Uniba (Italy), specifying culturing timelines, with the number of passages indicated in parentheses, the production of frozen aliquots, and metaphase preparations for each batch, along with the sequencing techniques applied to them.
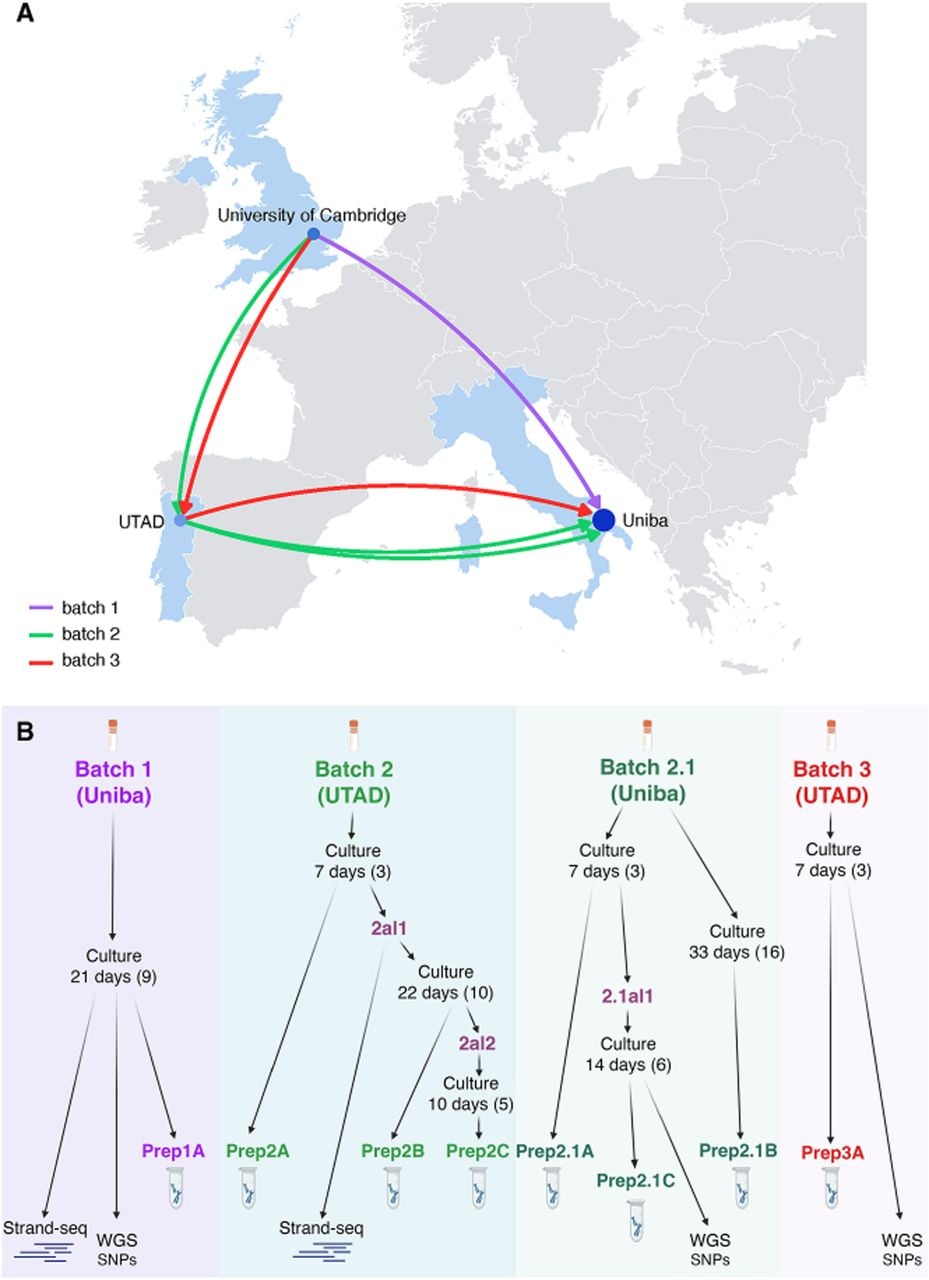
The second cell line batch (batch2), derived from the same N. siki individual, stocked at the Universidade de Trás-os-Montes e Alto Douro (UTAD; Portugal), was thawed at Uniba and kept in culture for 7 days (three passages). A first metaphase preparation (prep2A) was obtained at the end of the culture, and one aliquot of the cell line was frozen (aliquot 2al1).
Later, aliquot 2al1 was thawed and used for Strand-seq library preparation, which led to the sequencing of 99 single cells. The culture was further kept for an additional 22 days (10 passages), after which a second metaphase preparation (prep2B) was produced, and a second aliquot (2al2) was frozen. Following sequencing, aliquot 2al2 was thawed and cultured for 10 days (five passages) to obtain a metaphase preparation (prep2C).
All the metaphase preparations were used to perform FISH experiments, as described in the following paragraphs.
A third stock aliquot of the same cell line from Portugal (batch2.1) was cultured at Uniba to replicate the results. The culture was maintained for 33 days (16 passages), and two metaphase preparations were obtained from this third batch, one after 1 week of culture (prep2.1A; three passages) and the other after 33 days of culture (prep2.1B; 16 passages). Aliquot 2.1al1 was frozen after 7 days of culture (three passages) and cultured again for 14 days (six passages) to obtain the last metaphase preparation (prep2.1C) and genomic DNA.
Finally, a last aliquot from a different batch (batch3) of the same cell line from the UTAD in Portugal was thawed at Uniba and kept in culture for 7 days (three passages) to obtain a metaphase preparation (prep3A) and the genomic DNA (Fig. 1B; Supplemental Table S1).
All cell line batches originate from a common source: the University of Cambridge (Cambridge, United Kingdom). However, detailed information regarding their initial handling and precise transfer timelines to Uniba and UTAD is limited (Fig. 1A).
Single-cell template strand sequencing to identify structural rearrangements
Out of 99 single cells sequenced from N. siki (aliquot 2al1, batch2), 28 cells passed quality control and were used for further analyses. First, based on their orientations, we assigned each sequenced template strand to either a Crick (C; “+”) or a Watson (W; “–”) state. Then, to select the informative chromosomes for composite file construction, we identified those in either a WW or CC state (i.e., displaying template strands in the same orientation on both homologs) per cell. During this process, we observed that Chr 14 showed a different pattern for the p- and q-arms, with an increased read depth in only one of the two arms per cell. Similarly, Chromosome 22 was noted to behave nonhomogeneously across cells, with the majority of them having a partial switch from WW to WC or from CC to WC in the terminal region of the q-arm.
We then grouped the WW and CC chromosomes of 22 cells with an increased read depth on the q-arm of Chr 14 into a composite file (Fig. 2A) and those from six cells with increased read depth on the p-arm into a separate composite file and analyzed them separately. All the cells belonging to the first group (q-arm increased read-depth) showed a 17 Mb heterozygous inversion on the q-arm of Chromosome 22, whereas no such inversion was detected in the second group (p-arm increase). No additional structural differences were observed between the two composite files.
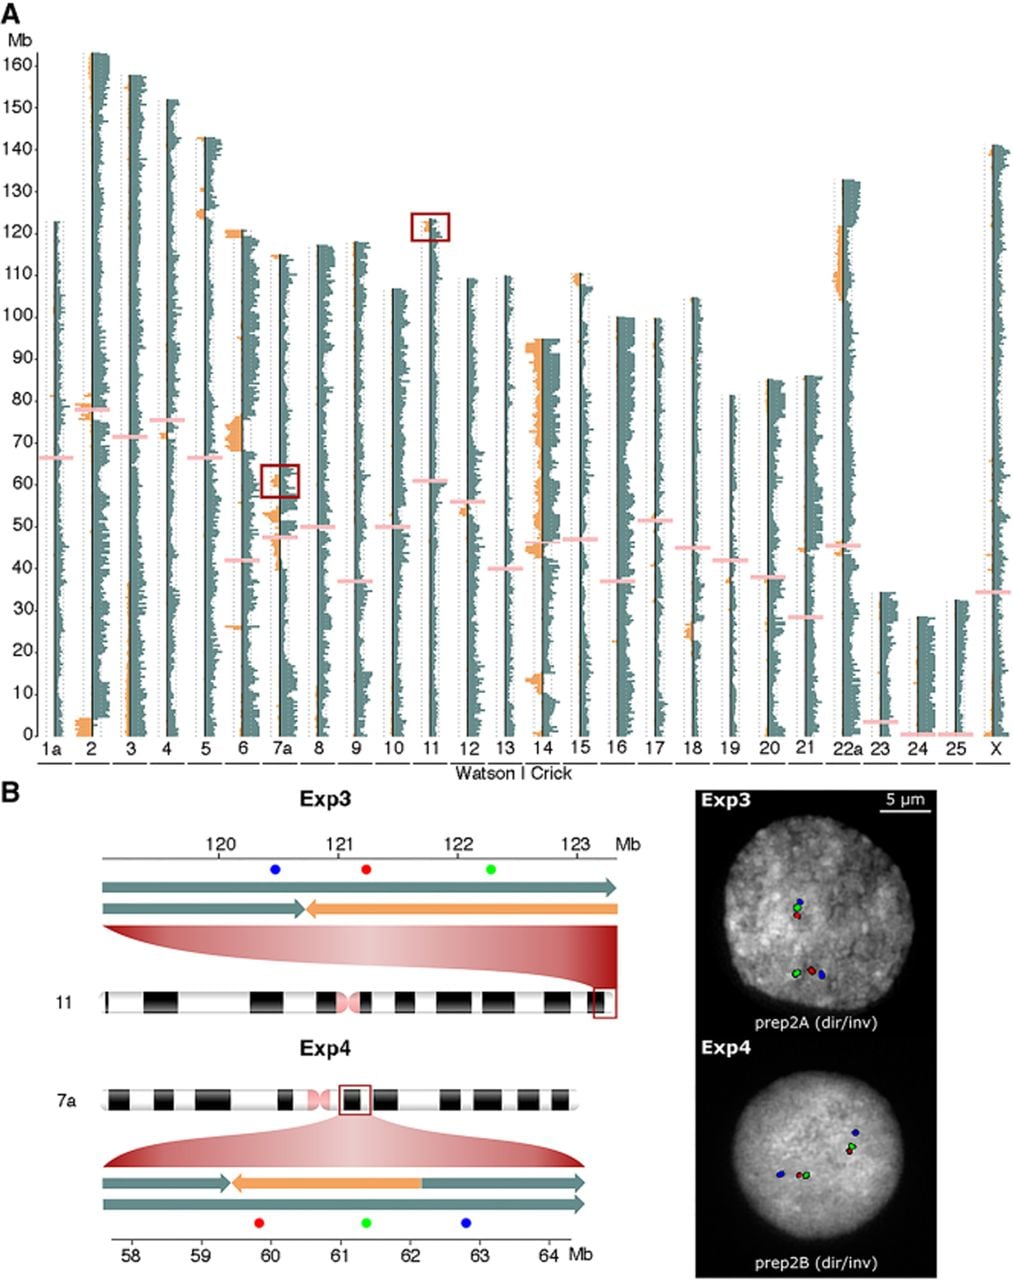
Detection and validation of heterozygous inversions. (A) Composite file for the Chromosome 14 iso-q subpopulation from batch2, built using the GGSC Nleu3.0/nomLeu3 reference genome. Orange and blue bins represent Watson (W) and Crick (C) strand inheritance, respectively, and pink ones represent centromeres. Chromosome 14 exhibits increased read depth and a clear p/q switch pattern, consistent with the presence of an isochromosome of the q-arm. Red squares highlight two of the detected heterozygous inversions. (B) Experimental validation by interphase FISH using locus-specific BAC probes (Supplemental Table S2). The schematic on the left shows the probe design and expected signal patterns for the directly oriented chromosomes. On the right, representative FISH images from nuclei in preparations prep2A (Exp3) and prep2B (Exp4) confirm the presence of the predicted heterozygous inversions (dir/inv configuration).
To further interpret these findings, we compared the composite files from batch2 with the one previously generated by Mercuri and colleagues (2022) from batch1, which was based on 62 informative cells from the same N. siki individual. That analysis had identified 22 inversions larger than 500 kb, including a 17 Mb heterozygous inversion on the terminal q-arm of Chromosome 22 (Chr 22a: 103,740,071–122,121,000, GGSC Nleu3.0/nomLeu3), consistently present in all sequenced cells (Fig. 3). This was confirmed to be the same event detected in batch2.
Circular plot displaying the map of chromosomal rearrangements detected by Strand-seq. Each concentric ring represents the read-depth profile (copy number [CN]) across chromosomes for a specific batch: batch1 (innermost ring, green inversions), iso-q subpopulation of batch2 (middle ring, red inversions), and iso-p subpopulation of batch2 (outermost ring, blue inversions). Yellow segments indicate regions with a CN of two, and orange segments mark regions with CN = 3, such as Chromosome 14 (trisomy) and the isochromosome arms in iso-p and iso-q subpopulations. Inversion events are shown as colored bars (green for batch1, red for iso-q batch2, and blue for iso-p batch2): Inversions plotted outside the corresponding ring indicate heterozygous events, and those plotted inside the ring denote homozygous inversions.
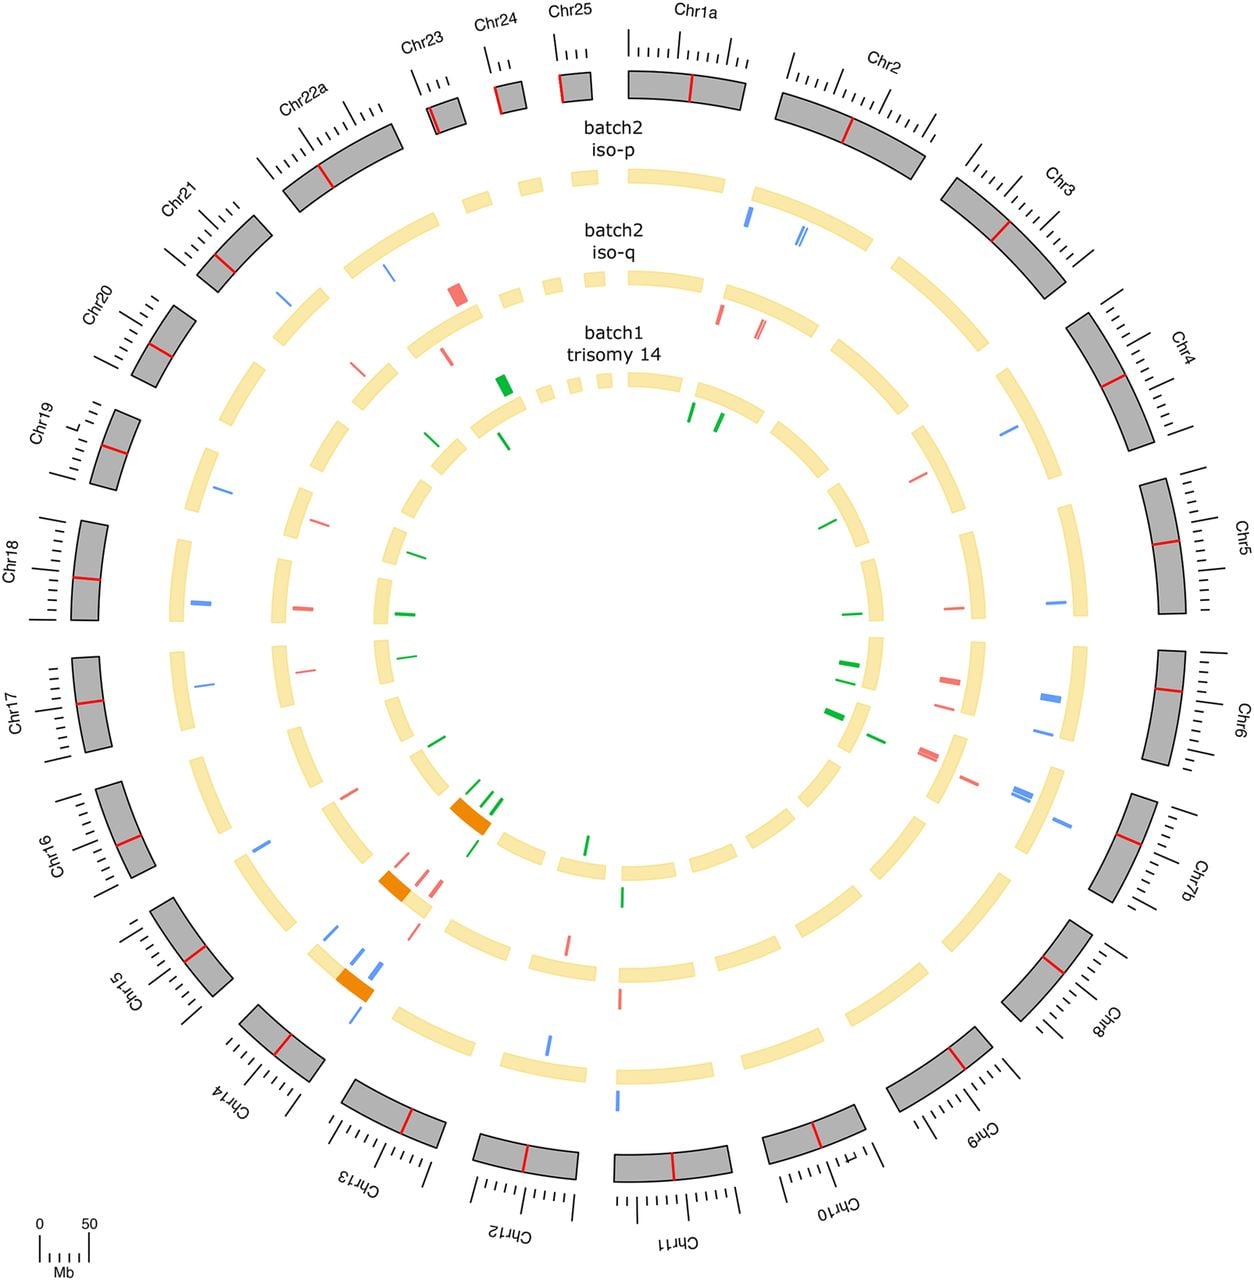
Read-depth analysis of Chr 14 in batch1 revealed consistent trisomy across all informative cells. In contrast, batch2 displayed increased read depth restricted to either the p-arm or the q-arm, indicating potential subclonal variation. When comparing the inversion profiles detected by Strand-seq in batch1 with those in the two batch2 subgroups (defined by p- or q-arm read-depth increases on Chr 14), no additional structural differences were observed (Fig. 3).
Characterization of structural variants
Chromosome inversions and translocations
To perform a cytogenomic characterization of the N. siki cell line, we first tested two major chromosomal rearrangements known to be variable in Nomascus genus (Hirai et al. 2007; Nie et al. 2018): the translocation between Chromosome 1 and Chromosome 22 (Exp1) and the pericentric inversion on Chromosome 7 (Exp2) (Table 1; Supplemental Table S2). Both experiments were conducted on metaphase preparations prep1A, prep2A, prep2B, prep2C, prep2.1A, and prep3A.
Molecular cytogenetic validation of chromosomal rearrangements across batches and subcultures
| BATCH1_PREP1A | BATCH2_PREP2A | BATCH2_PREP2B | BATCH2_PREP2C | BATCH2.1_PREP2.1A | BATCH2.1_PREP2.1B | BATCH2.1_PREP2.1C | BATCH3_PREP3A | |
|---|---|---|---|---|---|---|---|---|
| Exp1 t(1;22) | 1b/22b n = 5 | 1b/22b n = 3 | 1b/22b n = 20 | 1b/22b n = 20 | 1b/22b n = 2 | Not tested | Not tested | 1b/22b n = 3 |
| Exp2 inv(7) | 7b n = 4 | 7b n = 3 | 7b n = 22 | 7b n = 20 | 7b n = 2 | Not tested | Not tested | 7b n = 5 |
| Exp 3 inv(11) | Heta | Het (Dir = 8; Inv = 8) | Het (Dir = 12; Inv = 8) | Het (Dir = 7; Inv = 10) | Het (Dir = 11; Inv = 14) | Not tested | Not tested | Het (Dir = 6; Inv = 4) |
| Exp 4 inv(7) | Heta | Not tested | Het (Dir = 10; Inv = 9) | Het (Dir = 7; Inv = 10) | Het (Dir = 9; Inv = 8) | Not tested | Not tested | Not tested |
| Exp 5 inv(22) | Het (Dir = 16; Inv = 16) | Het (Dir = 17; Inv = 2) | Het (Dir = 5; Inv = 4) | Het (Dir = 3; Inv = 2) | Het (Dir = 33; Inv = 4) | Het (Dir = 39; Inv = 7) | Not tested | Het (Dir = 7; Inv = 7) |
| Exp 6 iso(14) | T14 n = 2 | i(14p) = 77,5% i(14q) = 22,5% n = 49 | i(14p) = 33,3% i(14q) = 66,7% n = 18 | i(14p) = 50% i(14q) = 50% n = 2 | i(14p) = 90,9% i(14q) = 9,1% n = 11 | Not tested | Not tested | T14 n = 5 |
| Exp 7 iso(14) + inv (22) | Not tested | Not tested | Iso-p + dir/dir = 36,8% Iso-q + dir/inv = 63,2% n = 19 | Iso-p + dir/dir = 28% Iso-q + dir/inv = 72% n = 25 | Iso-p + dir/dir = 65% Iso-q + dir/inv = 35% n = 20 | Iso-p + dir/dir = 56,3% Iso-q + dir/inv = 43,7% n = 16 | Iso-p + dir/dir = 87% Iso-q + dir/inv = 13% n = 23 | Not tested |
[i] Results of FISH experiments validating the presence and configuration of major chromosomal rearrangements in multiple metaphase preparations from the Nomascus siki cell line. (n) Number of observed metapahses or interphase nuclei, (dir) number of chromosomes showing direct orientation, (inv) number of chromosomes showing inverted orientation, (Het) heterozygous, (Iso) isochromosome, and (T) trisomy.
[ii] aMercuri et al. (2022).
Exp1 showed that all the tested metaphase preparations carry the 1b/22b form, whereas Exp2 revealed that all of them are homozygous for the 7b form.
Next, we tested three inversions that resulted heterozygous by Strand-seq in both batch1 and batch2, as shown in Figure 2: one inversion on Chromosome 11 (Chr 11: 120,740,681–123,032,604, GGSC Nleu3.0/nomLeu3; Exp3), one inversion on Chromosome 7 (Chr 7b: 59,498,669–62,277,588, GGSC Nleu3.0/nomLeu3; Exp4), and one on Chromosome 22 (Chr 22a: 103,740,071–122,121,000, GGSC Nleu3.0/nomLeu3; Exp5) (Table 1; Supplemental Table S2).
Exp3 was conducted on prep1A (Mercuri et al. 2022), prep2A (Fig. 2B), prep2B, prep2C, prep2.1A, and prep3A, confirming the heterozygous state of the inversion of Chromosome 11 on all preparations. Exp4, conducted on prep1A (Mercuri et al. 2022), prep2B (Fig. 2B), prep2C, and prep2.1A, similarly showed the presence of the heterozygous inversion on Chromosome 7 in all tested preparations.
Exp5 was conducted on a wide set of metaphase preparations, including prep1A, prep2A, prep2B, prep2C, prep2.1A, prep2.1B, and prep3A. The results revealed that the inversion on Chromosome 22a was not uniformly detected across samples: In some preparations, only the direct (noninverted) form of Chr 22a was observed; in others, both the direct and inverted forms were present, indicating a heterozygous inversion. The relative frequency of cells carrying the inversion varied considerably across preparations (Table 1).
iso-p, iso-q, trisomy, and Chromosome 22 inversion characterization
To investigate the increased read-depth on Chr 14 observed by Strand-seq in batch2 subpopulations, we performed a dedicated FISH experiment (Exp6) (Table 1; Supplemental Table S2). This consisted of a cohybridization with probes specific for the short (p) and long (q) arms of Chromosome 14 (Supplemental Table S2) and was performed on metaphase preparations from batch1 (prep1A), batch2 (prep2A, prep2B, prep2C), batch2.1 (prep2.1A), and batch3 (prep3A).
The results showed that batch1 and batch3 were trisomic for Chromosome 14, whereas in batch2 and batch2.1, metaphases contained either an isochromosome of the p-arm (iso-p) or of the q-arm (iso-q), in addition to the two normal homologs. This finding explains the arm-specific read-depth increases seen in Strand-seq and suggests the presence of distinct subclonal populations within the cultures.
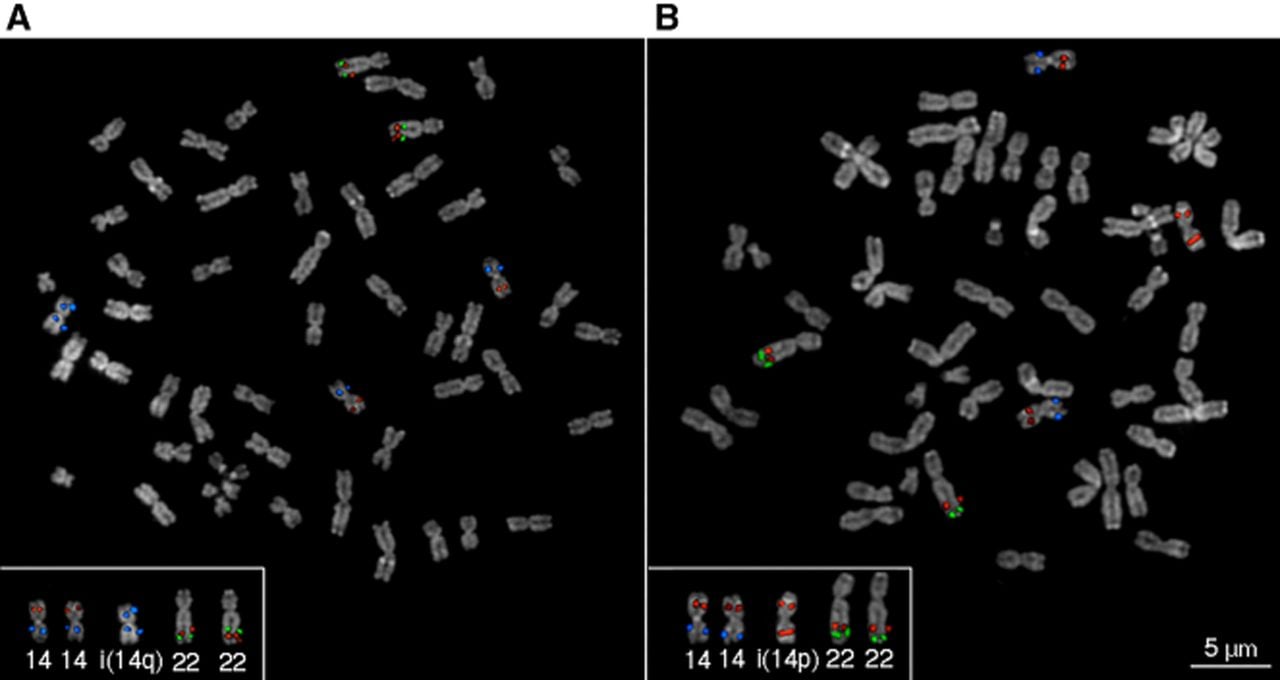
To further clarify the relationship between the inversion on Chromosome 22 and the structural status of Chromosome 14, we designed a combined FISH experiment (Exp7) by cohybridizing the probes from both Exp5 and Exp6 on the same metaphases. This experiment was carried out on prep2B, prep2C, prep2.1A, prep2.1B, and prep2.1C (Fig. 4; Supplemental Fig. S1). In line with the Strand-seq results, the heterozygous inversion on Chromosome 22 was observed only in metaphases carrying the iso-q (Fig. 4A; Supplemental Fig. S1). Conversely, the inversion was never detected in metaphases in which the iso-p was present (Fig. 4B; Supplemental Fig. S1). These findings support a clear association between the presence of the inversion in Chromosome 22 and a specific subpopulation defined by the structure of Chromosome 14.
Validation of isochromosomes and the Chromosome 22 inversion (inv22) by FISH. Cohybridization on metaphases from prep2.1A of BAC clones CH271-162A04 (red) and CH271-113K11 (blue) on Chromosome 14 and CH271-74O21 (red) and CH271-119L09 (green) on Chromosome 22. A wild-type Chromosome 14 exhibits one red hybridization signal on 14p and one blue signal on 14q. i(14p) shows two red signals on the same chromosome, and i(14q) shows two blue signals on the same chromosome. Similarly, the wild-type Chromosome 22 displays a centromere red–green signal pattern, whereas an inverted Chromosome 22 shows a centromere green–red signal pattern. This experiment confirms the presence of a supernumerary isochromosome i(14p)/i(14q) and demonstrates the presence of the inversion on Chromosome 22 in a heterozygous state but only in metaphases in which i(14q) is present. (A) FISH image of a metaphase with i(14q) and inversion on Chromosome 22 in a heterozygous state. (B) FISH image of metaphase with i(14p) and no Chromosome 22 inversion.
To clarify how such rearrangements might have functionally impacted the cell line, we performed an enrichment analysis on the human orthologs of the genes detected on the gibbon reference genome (GGSC Nleu3.0/nomLeu3) in the rearranged regions. We detected 136 genes in the inverted region on Chromosome 22, none of which are disrupted by the breakpoints; 386 genes on the p-arm of Chromosome 14; and 530 genes on the q-arm (Supplemental Table S3). Enrichment analysis, performed on the human orthologs using the GENE2FUNC module of FUMA, revealed a significant overrepresentation of genes involved in cell cycle regulation and progression (Supplemental Fig. S2A), along with a significant enrichment of genes that have been implicated in various tumor types when upregulated among those located on the p-arm of Chromosome 14 (Supplemental Fig. S2B).
Batch comparison at the SNP level
To assess the differences between the batches at a single-nucleotide level, we performed SNP-calling on WGS short-read data from batch1, batch2.1, and batch3. We obtained 14,373,821 calls, which were reduced to 10,843,361 by retaining only SNPs with filtered depth (DP) > 10 and genotype quality (GQ) > 20 in all the samples (see Methods). Among these, 10,651,171 SNPs displayed identical genotypes across the three batches: 6,252,888 were heterozygous (Ref/Alt) and 4,398,283 were homozygous for the alternative allele (Alt/Alt). Only 22 SNPs showed a fully divergent genotype among the three samples, in which each batch carried a different allelic state (one Ref/Ref, one Ref/Alt, one Alt/Alt).
For the remaining 192,168 SNPs, we performed pairwise comparisons to assess the number of identical genotypes shared between each pair. Batch1 and batch2.1 shared 55,613 identical SNPs, of which 1890 were homozygous for the reference allele, 24,490 were heterozygous, and 29,233 were homozygous for the alternative allele. The comparison between batch1 and batch3 revealed 64,133 shared SNPs, including 2212 homozygous for the reference allele, 28,281 heterozygous, and 33,640 homozygous for the alternative allele. Finally, batch2.1 and batch3 exhibited the highest number of identical SNPs, with 72,422 in total, comprising 2116 homozygous for the reference allele, 35,583 heterozygous, and 34,723 homozygous for the alternative allele. These results correspond to a shared SNP proportion of 98.74% between batch1 and batch2.1, 98.82% between batch1 and batch3, and 98.90% between batch2.1 and batch3 (Supplemental Table S4).
To further confirm the genetic identity of the batches, identity-by-descent analysis was performed using PLINK v1.9, showing a proportion of identical alleles of approximately 0.95 in all pairwise comparisons. Relationship inference using KING v2.2.6 supported these findings, with kinship coefficient ranging from 0.4845 to 0.4859 across all pairs, consistent with all three batches originating from the same individual (Supplemental Table S4).
Discussion
In this study, we demonstrated the emergence of large-scale chromosomal rearrangements across different batches of a N. siki lymphoblastoid cell line. By combining single-cell Strand-seq with cytogenetic assays, we uncovered a complex scenario of structural variation arising during in vitro culture.
Strand-seq analysis revealed that batch1 and batch2 not only share the same set of 22 inversion events but also display identical zygosity for each inversion (i.e., homozygous or heterozygous), strongly confirming their origin from the same individual.
This level of conservation across batches confirmed the clonal nature of the starting material, while enabling the detection of new, batch-specific alterations.
Crucially, additional rearrangements were detected in batch2, in which two distinct subpopulations could be identified. The first subpopulation carries the inversion profile of batch1, along with an extra iso-q of Chromosome 14. The second lacks the 17 Mb heterozygous inversion on Chromosome 22 and instead harbors a iso-p of Chromosome 14. The co-occurrence of the heterozygous inversion on Chromosome 22 and iso-q was further confirmed by FISH experiments, which consistently showed that these two rearrangements are found together in the same cells.
An evident progressive increase in the frequency of cells carrying both rearrangements was observed over time in batch2 metaphase preparations (prep2A, prep2B, prep2C) (Table 1), suggesting a possible clonal expansion and proliferative advantage of this subpopulation. A similar trend was also observed in the second replicate of the same batch (batch2.1), in which the proportion of cells with the inversion and iso-q increased by ∼10% between prep2.1A and prep2.1B, further supporting the hypothesis of selection-driven expansion under culture conditions.
The two batches lacking an isochromosome 14 (batch1 and batch3) were instead trisomic for Chromosome 14. This trisomy, like the isochromosomes observed in the other batches, likely represents a culture-induced rearrangement, as such alterations are generally incompatible with life. We propose that the extra copy of Chromosome 14 served as the substrate for isochromosome formation, which subsequently occurred clonally in batch2 and its replicate (batch2.1). In these, two distinct subpopulations were observed: one exhibiting loss of the p-arm and duplication of the q-arm of Chr 14, and the other showing the opposite pattern, the loss of the q-arm and duplication of the p-arm. We hypothesize that the additional copy of Chromosome 14 underwent transverse, rather than longitudinal, division during mitosis, with the two chromatid arms remaining joined at the half centromere (Schulz-Schaeffer 1980). As a result, an isochromosome of the p-arm would have segregated into one daughter cell, whereas an isochromosome of the q-arm segregated into the other (Fig. 5). Both cell lines subsequently expanded clonally, giving rise to the two observed subpopulations. Aneuploidies, such as the trisomy of Chromosome 14 observed in batch1 and batch3, may have initiated a cascade of genomic instability, increasing susceptibility to replication stress and DNA damage and ultimately promoting the accumulation of additional structural variants, including both copy-number and copy-neutral changes. Some of these karyotypic alterations may have conferred a proliferative advantage and gradually dominated the culture over time (Passerini et al. 2016). This framework could explain the selection of distinct subclones carrying isochromosomes in batch2 and its replicate batch2.1.
Hypothetical model for the generation of iso-p and iso-q chromosomes during mitosis. When entering mitosis, one of the three copies of Chromosome 14 (p-arm in red, q-arm in blue) undergoes transversal division instead of the canonical longitudinal one, leading to the inheritance of the iso-p chromosome, shown in red, along with two copies of Chromosome 14 on one daughter cell and of the iso-q, shown in blue, and two copies of Chromosome 14 in the other.
Notably, Chromosome 14 also stands out as the chromosome with the highest number of inversions, with four events >500 kb in size (present study and Mercuri et al. 2022), three in homozygous and one in heterozygous state, as well as 12 smaller inversions reported previously (Mercuri et al. 2022). Chromosome 14 is also known for its pronounced instability from an evolutionary perspective, as it represents the chromosome with the highest number of synteny blocks (n = 10) when comparing human and gibbon genomes. These blocks are derived from human Chromosomes 2 and 17 (Roberto et al. 2007; Capozzi et al. 2012; Carbone et al. 2014). Notably, human Chromosome 17 is among the top three human chromosomes most frequently involved in isochromosome formation (Kanagal-Shamanna et al. 2012; Onaka et al. 2020). Isochromosomes of the q-arm of Chromosome 17 in humans are among the most recurrent chromosomal aberrations in hematologic malignancies. These events are often associated with microdeletions of the 17p11 region and are believed to be facilitated by the presence of palindromic sequences at breakpoint sites (Fioretos et al. 1999; Barbouti et al. 2004).
Despite the presence of large-scale rearrangements arising in the different batches, the cell lines remained stable at the nucleotide level: ∼99% of SNPs maintained the same genotype across all batches. The high level of primary sequence conservation was further supported by both the identical-by-descent analysis and the relationship test, which classified the samples as duplicate individuals and monozygotic twins, respectively. These findings are consistent with previous studies, which have shown that cultured cell lines accumulate large chromosomal rearrangements more readily than single-nucleotide variants over time (Scheinfeldt et al. 2018; Volleth et al. 2020).
Notably, the rearrangements described here encompass hundreds of intact genes, including a significant overrepresentation of genes involved in cell cycle control and oncogenic processes, yet occur in the absence of detectable gene disruption or SNP divergence. This supports the view that karyotypic reorganization can modulate cellular behavior through system-level effects on gene networks, such as altered dosage balance or regulatory landscapes, rather than through classical gene-centric mutational mechanisms.
From an evolutionary perspective, the gibbon genome is uniquely characterized by an exceptional degree of chromosomal structural rearrangements compared with other apes. Numerous studies have shown that gibbons, unlike great apes and humans, have undergone a rapid rate of karyotypic evolution, with frequent inversions and translocations (Carbone et al. 2006, 2014; Roberto et al. 2007; Capozzi et al. 2012; Mercuri et al. 2022). However, the mechanisms underlying this genomic plasticity remain poorly understood. In this context, the N. siki cell line emerges as a promising in vitro model system to explore the mechanisms of genome reshaping. Its intrinsic susceptibility to genomic instability may amplify the effects of culture-induced stress, making it a valuable model to explore the interplay between culture conditions and genome architecture in primates.
From a broader evolutionary perspective, the decoupling observed here between extensive chromosomal restructuring and near-complete conservation at the nucleotide level raises important questions about the nature of genetic change during clonal evolution. Although evolutionary and cancer genomics have traditionally emphasized gene- and nucleotide-level variation, several genome-based frameworks propose that chromosomal architecture itself constitutes a distinct layer of biological information (Heng and Heng 2021, 2022). In this view, large-scale rearrangements alter the organization, dosage, and regulatory context of genes without necessarily changing their primary sequence. Such genome-level alterations have been proposed to drive system-level evolutionary transitions—sometimes referred to as macroevolutionary phases—followed by periods of relative nucleotide stability characterized by gene-level fine-tuning (Liu et al. 2014). Within this framework, the karyotype is not merely a passive carrier of genes but an active determinant of genetic networks and cellular behavior, such that identical genes can exhibit different functional outputs when embedded in different chromosomal contexts (Heng and Heng 2021).
Interpreted through this lens, the N. siki cell line provides an example of genome-level evolution occurring in real time: Distinct karyotypic configurations emerge, expand clonally, and appear to be selectively favored, despite sharing an almost identical SNP landscape. The observed chromosomal rearrangements, including isochromosome formation and inversion occurrence, may therefore represent alternative, heritable genomic states rather than transient by-products of instability. Similar patterns, marked chromosomal plasticity accompanied by limited nucleotide divergence, have been reported in cellular immortalization models and cancer evolution, supporting the idea that chromosomal variation itself can act as a primary substrate for selection (Duesberg et al. 1999; Ye et al. 2009). This interpretation does not exclude culture-induced stress or mechanistic drivers of rearrangement but instead highlights that chromosomal variation itself may constitute a primary substrate for selection during clonal expansion.
Our findings are therefore consistent with both mechanistic models of culture-induced genomic instability and genome-based evolutionary frameworks that emphasize chromosomal architecture as a key driver of genetic system reorganization.
Despite this study being limited to a single cell line, it underscores the critical importance of implementing routine monitoring of cell lines with increased culture time. More broadly, this work illustrates how cell culture conditions can act as a powerful accelerator of genome evolution, particularly in genomes already predisposed to structural plasticity. This work demonstrates the power of combining Strand-seq with cytogenetic assays to uncover genomic mutational events that might otherwise go undetected. In particular, the single-cell resolution of Strand-seq proves to be exceptionally effective for identifying subclonal populations and balanced rearrangements present in only a subset of cells, whereas FISH remains crucial to define the structural nature of the rearrangements, as exemplified by the case of isochromosomes.
By tracking the emergence, clonal behavior, and fixation of de novo chromosomal aberrations, this study offers a rare, dynamic view of genome instability in real time. To our knowledge, this is the first direct observation of isochromosome formation and selective clonal dynamics in a gibbon cell line. It provides novel insights into the interplay between inherent genomic plasticity and culture-driven evolution in primates and lays the groundwork for future investigations into mechanisms of structural mutagenesis across species.
Methods
Cell culture
The EBV-transformed lymphoblastoid N. siki cell lines were cultured in RPMI medium supplemented with 16% FBS, 1% L-glutamine, and 1% penicillin–streptomycin in a 5% CO2 humidified incubator at 37°C. At Uniba, growth was monitored daily by means of inverted microscopy, and cells were split 1:2 every 2 days. At UTAD, cells were cultured for two passages following the same procedure.
Strand sequencing and inversion identification
Strand-seq libraries were obtained from the cell culture following the protocol described by Sanders and colleagues (Falconer et al. 2012; Sanders et al. 2017) and sequenced on NextSeq 500 (MID-mode, 75 bp paired-end protocol). We demultiplexed according to the barcodes and converted raw data to FASTQ using bcl2fastq v2.19.0.316. Reads were then aligned to the gibbon reference genome (GGSC Nleu3.0/nomLeu3) with BWA-MEM (version 0.7.17) (Li 2013). The obtained SAM files were converted to BAM files and sorted with SAMtools view and SAMtools sort (version 0.7.17) (Li et al. 2009), and duplicate reads were marked using Picard MarkDuplicates (version 2.20.4-SNAPSHOT; https://broadinstitute.github.io/picard/). Strand-seq reads for each cell were counted and plotted with mosaicatcher v.0.3.1 (Weber et al. 2023) to assess the sequencing quality. Cells that had low coverage, had incomplete BrdU incorporation, or had already started the second round of BrdU incorporation were excluded during the manual quality evaluation.
To detect germline inversions, we merged single-cell data in a directional pseudobulk file, called a composite file, as previously described (Maggiolini et al. 2020; Mercuri et al. 2022). To do so, we used an in-house R script to identify all the chromosomes inherited in a CC (Crick; “+”) or WW (Watson; “–”) state among all the cells and merged those bulks into two files with SAMtools merge (Li et al. 2009). Then, we filtered both BAM files by SAMtools view (Li et al. 2009) to keep only the first read of each proper pair with a mapping quality greater than 10 and reverse-complemented all the reads of the WW chromosomes by converting the WW BAM file to BED file (BEDTools bamtobed), manually changing the mapping strand, and converting the BED file back to BAM file (BedToBam) (Quinlan and Hall 2010). The latter BAM file was merged with the one containing all the reads of the chromosomes inherited in a CC state with SAMtools merge (Li et al. 2009). The obtained composite BAM file was then sorted and indexed by using SAMtools sort and index (Li et al. 2009) and used as input for a breakpointR run (Porubsky et al. 2020), intending to identify inversion breakpoints and obtain a BED file loadable into the UCSC Genome Browser (Kent et al. 2002; Raney et al. 2024). Circular plots of the detected rearrangements in composite files were generated using the ggbio (v1.52.0) package (Yin et al. 2012) in R (v4.4.1) (R Core Team 2021).
SNP analysis
Genomic DNA was extracted from the cell cultures using FastPure blood/cell/tissue/bacteria dna isolation mini kit (Vazyme) and sequenced using NovaSeq X with a coverage of 30×.
Reads were then aligned to the gibbon reference genome (GGSC Nleu3.0/nomLeu3) with BWA-MEM (version 0.7.17) (Li 2013). The obtained SAM files were converted to BAM files and sorted with SAMtools view and SAMtools sort (version 0.7.17) (Li et al. 2009), and duplicate reads were marked using Picard MarkDuplicates (version 2.20.4-SNAPSHOT; https://broadinstitute.github.io/picard/). Germline short variants were called using GATK best practices workflows (Van der Auwera et al. 2013). We kept only SNPs with a DP between 10 and 75 and a GQ greater than 20. We then compared the state of all the retained SNPs in the sequenced samples using an R custom script.
Identity-by-descent analysis was performed using the option –genome from PLINK v1.9 (Chang et al. 2015) and the relationship inference using KING v2.2.6 (Manichaikul et al. 2010).
FISH
Three-color FISH experiments were conducted using human (n = 4) and gibbon BAC clones (n = 10) as detailed in Supplemental Table S2. The clones were directly labeled by nick-translation with Cy3-dUTP (PerkinElmer), Cy5-dUTP (PerkinElmer), and fluorescein-dUTP (Enzo), following the method described by Lichter et al. (1990) with minor adjustments. Hybridization took place at 37°C in a solution containing 2 × SSC, 50% formamide, 10% dextran sulfate, and 3 mg of sonicated salmon sperm DNA, totaling 10 mL. Posthybridization washes were performed at 60°C in 0.1 × SSC (three times for high stringency hybridizations using species-specific clones) or at 42°C in 2 × SSC (four times each for cross-species hybridizations). Nuclei and metaphases were stained with DAPI. Digital images were captured using a Leica DMRXA2 epifluorescence microscope with a cooled CCD camera (Princeton Instruments). Fluorescence signals from DAPI, Cy3, Cy5, and fluorescein were detected with specific filters, recorded as grayscale images, and later pseudocolored and merged using Adobe Photoshop. Interphase nuclei FISH involved three-color FISH with two probes within the predicted inversion and one reference probe outside, whereas metaphase chromosome FISH used two probes within the inverted region.
Enrichment analysis
Gibbon genes located within the 17 Mb inversion on Chromosome 22, as well as on the p- and q-arms of Chromosome 14, were extracted from the curated subset of the RefSeq track in the UCSC Genome Browser for the GGSC Nleu3.0/nomLeu3 reference genome (Pruitt et al. 2014). Human orthologs of these genes were analyzed using the GENE2FUNC module of FUMA, which annotates genes in a biological context by mapping associated diseases and known drug targets based on OMIM and DrugBank identifiers, assesses tissue-specific expression patterns using GTEx v6 RNA-seq data, and evaluates functional enrichment of gene sets using a hypergeometric test against curated biological pathways and functional categories derived from MSigDB and WikiPathways (Watanabe et al. 2017).
Data access
The Strand-seq library sequence data and WGS data generated from this study have been submitted to the NCBI BioProject database (https://www.ncbi.nlm.nih.gov/bioproject/) under accession number PRJNA1131178. The custom code used for SNP analysis is available as Supplemental Code.
Competing interest statement
The authors declare no competing interests.
Acknowledgments
This research was supported by the Italian Ministry of University and Research (MUR) grant PRIN 2020 (project code 2020J84FAM, CUP H93C20000040001). We also acknowledge financial support under the National Recovery and Resilience Plan (NRRP), mission 4, component 2, investment 1.1, Calls for tender no. 104 and no. 1409 published, respectively, on February 2, 2022, and on September 4, 2022, by the Italian Ministry of University and Research (MUR), funded by the European Union–NextGenerationEU. The project title for call for tender no. 104 is insights into the fast genome evolution of Gibbons through single-cell strand sequencing and simulation-based approaches–project code 202228ZTEJ, CUP H53D23001720006–grant assignment decree no. 970 adopted on June 30, 2023, by the Italian Ministry of University and Research (MUR). We thank Fengtang Yang and acknowledge the late Professor Malcolm Ferguson-Smith (University of Cambridge) for kindly providing the N. siki cell line.
Author contributions: C.R.C. and F.A. conceived and designed the experiments. S.L. shared the cell line. A.D., G.C., A.P., and A.M. collected the data. A.D., A.P., F.D.L., O.D.D., and M.M. performed single-cell library construction. A.D., G.C., F.A., and C.R.C. performed the analysis. C.M., S.L., A.D.S., F.A.M.M., and A.L. contributed to data analysis. A.D., G.C., F.A., and C.R.C. wrote the paper. All authors have read and agreed to the published version of the manuscript.
Footnotes
[3] Supplementary material [Supplemental material is available for this article.]
[4] Article published online before print. Article, supplemental material, and publication date are at https://www.genome.org/cgi/doi/10.1101/gr.281368.125.
References
- ↵Banerjee R, Sotero-Caio CG, Fu B, Yang F. 2022. Chromosomal instability (CIN) in HAP1 cell lines revealed by multiplex fluorescence in situ hybridisation (M-FISH). Mol Cytogenet 15: 46. 10.1186/s13039-022-00625-x
- ↵Barbouti A, Stankiewicz P, Nusbaum C, Cuomo C, Cook A, Höglund M, Johansson B, Hagemeijer A, Park S-S, Mitelman F, 2004. The breakpoint region of the most common isochromosome, i(17q), in human neoplasia is characterized by a complex genomic architecture with large, palindromic, low-copy repeats. Am J Hum Genet 74: 1–10. 10.1086/380648
- ↵Brandon-Jones D, Eudey AA, Geissmann T, Groves CP, Melnick DJ, Morales JC, Shekelle M, Stewart C-B. 2004. Asian primate classification. Int J Primatol 25: 97–164. 10.1023/B:IJOP.0000014647.18720.32
- ↵Capozzi O, Carbone L, Stanyon RR, Marra A, Yang F, Whelan CW, de Jong PJ, Rocchi M, Archidiacono N. 2012. A comprehensive molecular cytogenetic analysis of chromosome rearrangements in gibbons. Genome Res 22: 2520–2528. 10.1101/gr.138651.112
- ↵Carbone L, Vessere GM, ten Hallers BFH, Zhu B, Osoegawa K, Mootnick A, Kofler A, Wienberg J, Rogers J, Humphray S, 2006. A high-resolution map of synteny disruptions in gibbon and human genomes. PLoS Genet 2: e223. 10.1371/journal.pgen.0020223
- ↵Carbone L, Alan Harris R, Gnerre S, Veeramah KR, Lorente-Galdos B, Huddleston J, Meyer TJ, Herrero J, Roos C, Aken B, 2014. Gibbon genome and the fast karyotype evolution of small apes. Nature 513: 195–201. 10.1038/nature13679
- ↵Chang CC, Chow CC, Tellier LC, Vattikuti S, Purcell SM, Lee JJ. 2015. Second-generation PLINK: rising to the challenge of larger and richer datasets. GigaScience 4: 7. 10.1186/s13742-015-0047-8
- ↵Duesberg P, Rasnick D, Li R, Winters L, Rausch C, Hehlmann R. 1999. How aneuploidy may cause cancer and genetic instability. Anticancer Res 19: 4887–4906.
- ↵Falconer E, Hills M, Naumann U, Poon SSS, Chavez EA, Sanders AD, Zhao Y, Hirst M, Lansdorp PM. 2012. DNA template strand sequencing of single-cells maps genomic rearrangements at high resolution. Nat Methods 9: 1107–1112. 10.1038/nmeth.2206
- ↵Fan P-F, He K, Chen X, Ortiz A, Zhang B, Zhao C, Li Y-Q, Zhang H-B, Kimock C, Wang W-Z, 2017. Description of a new species of Hoolock gibbon (Primates: Hylobatidae) based on integrative taxonomy. Am J Primatol 79: e22631. 10.1002/ajp.22631
- ↵Fioretos T, Strömbeck B, Sandberg T, Johansson B, Billström R, Borg Å, Nilsson P-G, Van Den Berghe H, Hagemeijer A, Mitelman F, 1999. Isochromosome 17q in blast crisis of chronic myeloid leukemia and in other hematologic malignancies is the result of clustered breakpoints in 17p11 and is not associated with coding TP53 mutations. Blood 94: 225–232. 10.1182/blood.V94.1.225.413k24_225_232
- ↵Frattini A, Fabbri M, Valli R, De Paoli E, Montalbano G, Gribaldo L, Pasquali F, Maserati E. 2015. High variability of genomic instability and gene expression profiling in different HeLa clones. Sci Rep 5: 15377. 10.1038/srep15377
- ↵He Z, Wilson A, Rich F, Kenwright D, Stevens A, Low YS, Thunders M. 2023. Chromosomal instability and its effect on cell lines. Cancer Rep 6: e1822. 10.1002/cnr2.1822
- ↵Heng J, Heng HH. 2021. Karyotype coding: the creation and maintenance of system information for complexity and biodiversity. BioSystems 208: 104476. 10.1016/j.biosystems.2021.104476
- ↵Heng J, Heng HH. 2022. Genome chaos: creating new genomic information essential for cancer macroevolution. Semin Cancer Biol 81: 160–175. 10.1016/j.semcancer.2020.11.003
- ↵Hirai H, Hirai Y, Domae H, Kirihara Y. 2007. A most distant intergeneric hybrid offspring (Larcon) of lesser apes, Nomascus leucogenys and Hylobates lar. Hum Genet 122: 477–483. 10.1007/s00439-007-0425-0
- ↵Kanagal-Shamanna R, Bueso-Ramos CE, Barkoh B, Lu G, Wang S, Garcia-Manero G, Vadhan-Raj S, Hoehn D, Medeiros LJ, Yin CC. 2012. Myeloid neoplasms with isolated isochromosome 17q represent a clinicopathologic entity associated with myelodysplastic/myeloproliferative features, a high risk of leukemic transformation, and wild-type TP53. Cancer 118: 2879–2888. 10.1002/cncr.26537
- ↵Kent WJ, Sugnet CW, Furey TS, Roskin KM, Pringle TH, Zahler AM, Haussler D. 2002. The human genome browser at UCSC. Genome Res 12: 996–1006. 10.1101/gr.229102
- ↵Lacoste S, Wiechec E, dos Santos Silva AG, Guffei A, Williams G, Lowbeer M, Benedek K, Henriksson M, Klein G, Mai S. 2010. Chromosomal rearrangements after ex vivo Epstein–Barr virus (EBV) infection of human B cells. Oncogene 29: 503–515. 10.1038/onc.2009.359
- ↵Li H. 2013. Aligning sequence reads, clone sequences and assembly contigs with BWA-MEM. arXiv:1303.3997 [q-bio.GN]. 10.48550/arXiv.1303.3997
- ↵Li H, Handsaker B, Wysoker A, Fennell T, Ruan J, Homer N, Marth G, Abecasis G, Durbin R, 1000 Genome Project Data Processing Subgroup. 2009. The Sequence Alignment/Map format and SAMtools. Bioinformatics 25: 2078–2079. 10.1093/bioinformatics/btp352
- ↵Lichter P, Tang CJ, Call K, Hermanson G, Evans GA, Housman D, Ward DC. 1990. High-resolution mapping of human chromosome 11 by in situ hybridization with cosmid clones. Science 247: 64–69. 10.1126/science.2294592
- ↵Liu G, Stevens JB, Horne SD, Abdallah BY, Ye KJ, Bremer SW, Ye CJ, Chen DJ, Heng HH. 2014. Genome chaos: survival strategy during crisis. Cell Cycle 13: 528–537. 10.4161/cc.27378
- ↵Maggiolini FAM, Sanders AD, Shew CJ, Sulovari A, Mao Y, Puig M, Catacchio CR, Dellino M, Palmisano D, Mercuri L, 2020. Single-cell strand sequencing of a macaque genome reveals multiple nested inversions and breakpoint reuse during primate evolution. Genome Res 30: 1680–1693. 10.1101/gr.265322.120
- ↵Manichaikul A, Mychaleckyj JC, Rich SS, Daly K, Sale M, Chen W-M. 2010. Robust relationship inference in genome-wide association studies. Bioinformatics 26: 2867–2873. 10.1093/bioinformatics/btq559
- ↵Mercuri L, Palmisano D, L'Abbate A, D'Addabbo P, Montinaro F, Catacchio CR, Hasenfeld P, Ventura M, Korbel JO, Sanders AD, 2022. A high-resolution map of small-scale inversions in the gibbon genome. Genome Res 32: 1941–1951. 10.1101/gr.276960.122
- ↵Naumann N, Jawhar M, Schwaab J, Kluger S, Lübke J, Metzgeroth G, Popp HD, Khaled N, Horny H-P, Sotlar K, 2018. Incidence and prognostic impact of cytogenetic aberrations in patients with systemic mastocytosis. Genes Chromosomes Cancer 57: 252–259. 10.1002/gcc.22526
- ↵Nie W-H, Wang J-H, Su W-T, Hu Y, He S-W, Jiang X-L, He K. 2018. species identification of crested gibbons (Nomascus) in captivity in China using karyotyping- and PCR-based approaches. Zool Res 39: 356–363. 10.24272/j.issn.2095-8137.2018.036
- ↵Onaka AT, Su J, Katahira Y, Tang C, Zafar F, Aoki K, Kagawa W, Niki H, Iwasaki H, Nakagawa T. 2020. DNA replication machinery prevents Rad52-dependent single-strand annealing that leads to gross chromosomal rearrangements at centromeres. Commun Biol 3: 202. 10.1038/s42003-020-0934-0
- ↵Passerini V, Ozeri-Galai E, de Pagter MS, Donnelly N, Schmalbrock S, Kloosterman WP, Kerem B, Storchová Z. 2016. The presence of extra chromosomes leads to genomic instability. Nat Commun 7: 10754. 10.1038/ncomms10754
- ↵Porubsky D, Sanders AD, Taudt A, Colomé-Tatché M, Lansdorp PM, Guryev V. 2020. breakpointR: an R/Bioconductor package to localize strand state changes in Strand-seq data. Bioinformatics 36: 1260–1261. 10.1093/bioinformatics/btz681
- ↵Pruitt KD, Brown GR, Hiatt SM, Thibaud-Nissen F, Astashyn A, Ermolaeva O, Farrell CM, Hart J, Landrum MJ, McGarvey KM, 2014. RefSeq: an update on mammalian reference sequences. Nucleic Acids Res 42: D756–D763. 10.1093/nar/gkt1114
- ↵Quinlan AR, Hall IM. 2010. BEDTools: a flexible suite of utilities for comparing genomic features. Bioinformatics 26: 841–842. 10.1093/bioinformatics/btq033
- ↵Raney BJ, Barber GP, Benet-Pagès A, Casper J, Clawson H, Cline MS, Diekhans M, Fischer C, Navarro Gonzalez J, Hickey G, 2024. The UCSC Genome Browser database: 2024 update. Nucleic Acids Res 52: D1082–D1088. 10.1093/nar/gkad987
- ↵R Core Team. 2021. R: a language and environment for statistical computing. R Foundation for Statistical Computing, Vienna. https://www.R-project.org/.
- ↵Roberto R, Capozzi O, Wilson RK, Mardis ER, Lomiento M, Tuzun E, Cheng Z, Mootnick AR, Archidiacono N, Rocchi M, 2007. Molecular refinement of gibbon genome rearrangements. Genome Res 17: 249–257. 10.1101/gr.6052507
- ↵Roos C, Geissmann T. 2001. Molecular phylogeny of the major hylobatid divisions. Mol Phylogenet Evol 19: 486–494. 10.1006/mpev.2001.0939
- ↵Roschke AV, Stover K, Tonon G, Schäffer AA, Kirsch IR. 2002. Stable karyotypes in epithelial cancer cell lines despite high rates of ongoing structural and numerical chromosomal instability. Neoplasia 4: 19–31. 10.1038/sj.neo.7900197
- ↵Sanders AD, Falconer E, Hills M, Spierings DCJ, Lansdorp PM. 2017. Single-cell template strand sequencing by strand-seq enables the characterization of individual homologs. Nat Protoc 12: 1151–1176. 10.1038/nprot.2017.029
- ↵Scheinfeldt LB, Hodges K, Pevsner J, Berlin D, Turan N, Gerry NP. 2018. Genetic and genomic stability across lymphoblastoid cell line expansions. BMC Res Notes 11: 558. 10.1186/s13104-018-3664-3
- ↵Schulz-Schaeffer J. 1980. Ring-chromosomes, telocentric chromosomes, isochromosomes, and B chromosomes. In Cytogenetics: plants, animals, humans (ed. Schulz-Schaeffer J), pp. 159–74. Springer, New York.
- ↵Thinh VN, Mootnick A, Thanh V, Nadler T, Roos C. 2010. A new species of crested gibbon, from the central Annamite mountain range. Vietnamese J Primatol 4: 1–12.
- ↵Van der Auwera GA, Carneiro MO, Hartl C, Poplin R, del Angel G, Levy-Moonshine A, Jordan T, Shakir K, Roazen D, Thibault J, 2013. From FastQ data to high confidence variant calls: the Genome Analysis Toolkit best practices pipeline. Curr Protoc Bioinformatics 43: 11.10.1–11.10.33. 10.1002/0471250953.bi1110s43
- ↵Volleth M, Zenker M, Joksic I, Liehr T. 2020. Long-term culture of EBV-induced human lymphoblastoid cell lines reveals chromosomal instability. J Histochem Cytochem 68: 239–251. 10.1369/0022155420910113
- ↵Wang D, Cearlock A, Lane K, Xu C, Jan I, McCartney S, Glass I, McCoy R, Yang M. 2025. Chromosomal instability in human trophoblast stem cells and placentas. Nat Commun 16: 3918. 10.1038/s41467-025-59245-9
- ↵Watanabe K, Taskesen E, van Bochoven A, Posthuma D. 2017. Functional mapping and annotation of genetic associations with FUMA. Nat Commun 8: 1826. 10.1038/s41467-017-01261-5
- ↵Weber T, Cosenza MR, Korbel J. 2023. MosaiCatcher v2: a single-cell structural variations detection and analysis reference framework based on Strand-seq. Bioinformatics 39: btad633. 10.1093/bioinformatics/btad633
- ↵Ye CJ, Stevens JB, Liu G, Bremer SW, Jaiswal AS, Ye KJ, Lin M-F, Lawrenson L, Lancaster WD, Kurkinen M, 2009. Genome based cell population heterogeneity promotes tumorigenicity: the evolutionary mechanism of cancer. J Cell Physiol 219: 288–300. 10.1002/jcp.21663
- ↵Yin T, Cook D, Lawrence M. 2012. ggbio: an R package for extending the grammar of graphics for genomic data. Genome Biol 13: R77. 10.1186/gb-2012-13-8-r77
- ↵Yoo D, Rhie A, Hebbar P, Antonacci F, Logsdon GA, Solar SJ, Antipov D, Pickett BD, Safonova Y, Montinaro F, 2025. Complete sequencing of ape genomes. Nature 641: 401–418. 10.1038/s41586-025-08816-3