Bioinformatics traditionally covers data on protein structures, DNA sequences and gene mapping, but, especially since the initiation of the Human Genome Mapping Project, it now includes functional and other information. Here, we consider how bioinformatics can also handle patterns of gene expression in embryos, particularly the mouse, and discuss how the use of databases containing such information could help solve one of the major problems in contemporary developmental biology, elucidating the genetic networks responsible for tissue differentiation and organogenesis.
The key data here are the expression patterns of genes and the phenotypic effects of gene mutations; once these are in place for a given phenomenon, we can start to identify the underlying genetic network. Unfortunately, this information cannot usually be obtained from the standard literature databases, even with their search facilities: Not only are the relevant terms often absent from titles and abstracts, but the data are sometimes not published, as researchers now have more material than editors will accept. The most important point, however, is that the gene-expression descriptions are not made with a standardized nomenclature or other spatial reference so that one cannot be sure whether literature searches based on a gene or a tissue name are comprehensive. Those who work with gene expression are discovering something that has been obvious for some time to people in other fields: The best way of archiving and accessing data is through databases.
Bioinformatics and Databases
Although databases can store very large amounts of information, the key to successfully using them is the existence of appropriate semantic frameworks for inputting, storing and querying their data (e.g., for genome databases, the key data are the name,genomic location, and sequence). Similarly, the scientific literature databases contain entries stored under a series of attributes (e.g., author, journal, title, etc.) that can be searched separately or together to retrieve those papers that match the search terms. Image data can also be stored and retrieved, but there are as yet no standard mechanisms for comparing images or indeed for matching the information within them.
Gene expression data do not exactly match any of these examples as they are based on both text and graphical information. These data have four obvious properties, gene name (and associated details),tissue(s) in which the gene is expressed, spatial location (with tissue names being derived from the spatial location), and expression, which is of course limited to atemporal window. A gene-expression database should ideally provide comparisons of spatial regions and patterns, and this implies that data must be mapped into a common spatial and temporal framework. The simple way to do this is to use text terms to link anatomical and genetic data (e.g., via anatomical names and developmental stages), but such a database has limitations (see below). A more general solution is to map gene-expression data onto models of embryos using a common 3D coordinate system. In such a graphical database, spatial comparisons and relationships become straightforward and clear.
An ideal gene-expression database should have several properties. First, it should be searchable both spatially and textually (e.g., tissue, gene name, and 3D location); second, it should be comprehensive; third, it must be accessible over the internet; and, fourth, it should be easy to use. An additional, subtler criterion is that it be interoperable with other bioinformatics resources.
It should be emphasized that nothing yet meets all of these criteria, and the only comprehensive gene-expression databases currently available seem to be those for kidneys, ducted glands, and teeth in the developing mouse (Table 1; Davies et al. 1997). Additional databases are now being implemented (often as extensions of existing databases) for all of the main developmental organisms and will be available over the next few years—a human database is also being planned, and information on many housekeeping genes is documented in the yeast protein database (see Table 1; Davidson et al. 1998).
Some Key Web Sites for Developmental Databases Dealing with Gene Expression and Anatomy
| Name[i] | URL |
| AC. elegans Database (ACeDB) | http://www.sanger.ac.uk/Software/Acedb/ |
| The Nematode Expression Pattern DataBase | http://watson.genes.nig.ac.jp:8080/db/readme.html |
| Flyview | http://pbio07.uni-muenster.de/ |
| The Zebrafish Database (ZFIN) | http://zfish.uoregon.edu |
| Mouse Text Gene-Expression Database (GXD/MGI) | http://www.informatics.jax.org/gxd.html |
| Mouse Graphical Gene-Expression Database (GGED + DMDA*) | http://genex.hgu.mrc.ac.uk/ |
| Kidney and Ducted-Gland Gene-Expression Databases | http://www.ana.ed.ac.uk/anatomy/database/ |
| The Tooth Database | http://honeybee.helsinki.fi/toothexp/toothexp.htm |
| Human Anatomy Database | http://www.ana.ed.ac.uk/anatomy/database/humat/ |
| Atlas of Primate Brain | http://rprcsgi.rprc.washington.edu/∼atlas/ |
| TBase (targeted mutations in the mouse) | http://tbase.jax.org/ |
| Xenopus Molecular Marker Resource | http://vize222.zo.utexas.edu/ |
| Yeast Protein Database (YPD) | http://www.proteome.com/YPDhome.html |
[i] (*) Only the DMDA currently incorporates CORBA.
Making a Mouse Gene-Expression Database
The most helpful way of seeing how such a database should be constructed is to consider the type of questions that it has to answer, and a typical, but difficult example would be along the lines of, “Which tissues lie within 200 μm of a particular signaling molecule when it is first expressed, and which new genes do they then express?” To answer this, the database must contain time-dependent information linking tissue names, gene-expression domains, and tissue geometry. We consider here how these components are being implemented for the mouse embryo. One also needs to know if there is information from other embryos about this signaling molecule, and we therefore consider how the search domain could be extended. To help put things in context, we consider how these various databases can help elucidate the differentiation of mesenchymal aggregates (see Fig. 1 in BoxFigure B1.).
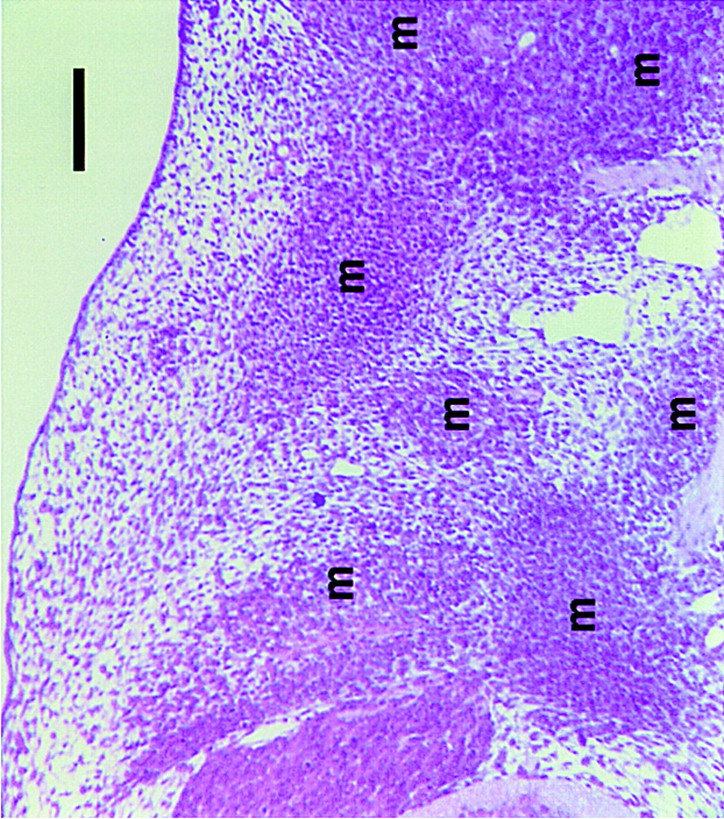
A light micrograph of a section through the flank mesenchyme of an E12.5 mouse embryo just medial to the forelimb (stained with H&E). Arrows mark domains of condensed, but as yet undifferentiated mesenchyme that have segregated from loose mesenchyme. These aggregates will become bones and muscles (Bar, 100 μm).
Analyzing Mesenchyme Differentiation
To illustrate the use of gene-expression databases, we consider the example of the mesenchymal aggregates that form in mice. Mesenchyme is, it should be said, something of a catch-all word that describes apparently undifferentiated masses of cells in early embryos that mainly derive from mesoderm and will eventually form a wide range of tissues that includes bones, muscles, hair follicles, feathers, teeth, and nephrons. The first step in the formation of each is the aggregation of a group of mesenchymal cells to form a condensation (Fig. 1). Understanding how these different tissues form from apparently very similar cells and condensations is a problem whose difficulty almost rivals that of the formation of the nervous system, but it is already clear that each requires a complex genetic pathway involving signals, receptors, transduction pathways, and tiers of transcription factors (for review, see Bard and Lehtonen 1996), as well as a wide range of morphogenetic mechanisms (Bard 1990). Once the databases discussed here are in place, their integrated use will help elucidate the various developmental pathways in the following ways:
• The anatomy database (DMDA) will provide a means of seeing when all these aggregates form (most, it turns out, appear at about E12-13). • The text database (GXD) will detail those genes first expressed in early condensations and additional genes expressed as they differentiate. • The graphical database (GGED) will give signaling and other genes expressed in the vicinity of condensations before they appear. • The transgenic database (TBase) will give data on the function of genes expressed as aggregates differentiate. • Interoperability will detail the behavior of homologous genes in other organisms.
Anatomical Data
The names of all the tissues at each developmental stage provide the standard terminology for handling gene-expression data and this information is stored in the Database of Mouse Developmental Anatomy(DMDA; Table 1). The DMDA contains a hierarchy of all the tissues present in the mouse embryo at each Theiler stage (TS) of development up to TS 22 (E14, Bard et al. 1998). It also provides a standard checklist for analyzing both normal and transgenic embryos.
The DMDA is quite detailed and currently includes some 7000 entries, with the hierarchy extending to a depth of about eight levels (Fig.2, and below). This detail is required because as the database provides the input and query language for the text gene-expression database and Mouse Atlas, it has to include subordinate tissues (e.g., each somite and its derivatives is mentioned separately at each stage of development).
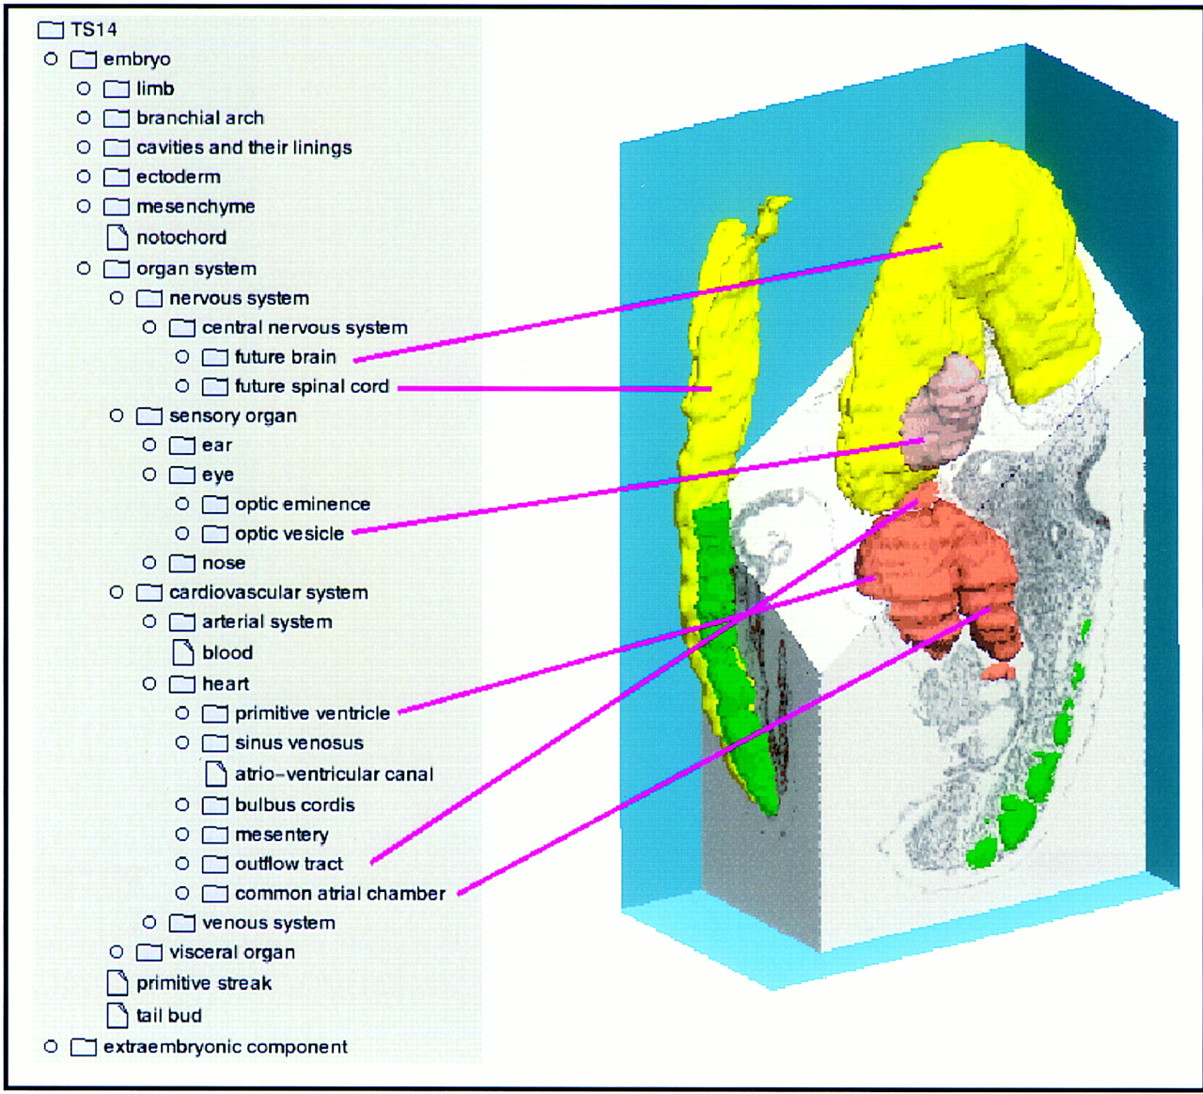
A composite showing part of the interface of the DMDA for a TS 14 (E9) embryo. A few of the tissue names are linked to the appropriate domains in a 3D reconstruction of this embryo.
The database itself is implemented using an object-oriented database management system (ObjectStore) with a Java interface that allows detailed control over which parts of the hierarchy are visible (Fig.2). The database interface to the outside world will incorporate the CORBA standard (Common Objects Request Broker Architecture; see below).
Gene Expression Data in Text Format
Expression data are held in the mouse Gene Expression Database (GXD) built by the Mouse Genome Informatics Group at The Jackson Laboratory (Bar Harbor, Maine; Ringwald et al. 1997) and is currently being tested (it should be accessible by the end of 1998). This relational database associates gene-expression data (both protein and mRNA) with the tissues listed in the DMDA. Other attributes include the details of the genes expressed and the nature of the expression pattern. The database also includes pictures of original gene-expression data (these are not directly mapped to the DMDA or to an embryo location, see below). The GXD already contains large amounts of data from the mouse gene-expression literature collected by its editorial staff, and the relevant publications are listed in the database.
In the context of queries about a signaling molecule, the GXD can indicate the tissues in which the signal is expressed but cannot detail neighboring tissues as it contains no geometric information. The GXD has other limitations relevant to early development: It links gene-expression data to tissue name and not tissue location; thus, it cannot easily handle gene-expression patterns expressed in parts of tissues, nor can it handle quantitative data (other than as notes). This is a serious problem as the genes that specify new tissues will, by definition, play a role in partitioning extant ones and so only be expressed in portions of them. These genes are, of course, those that must be identified to understand how new tissues form in embryos.
Gene Expression Data in Graphical Format
To handle data for genes whose expression domains do not map to whole tissues and to deal with spatial questions, we need a database whose underlying structure incorporates the geometry of the developing embryo. The obvious way of doing this is to include in the database digital representations of mouse embryos and their constituent tissues spanning the necessary age windows. Once these, together with appropriate software, are in place, domains of gene expression can be mapped directly into their appropriate locations and then interrogated spatially (Fig. 3).
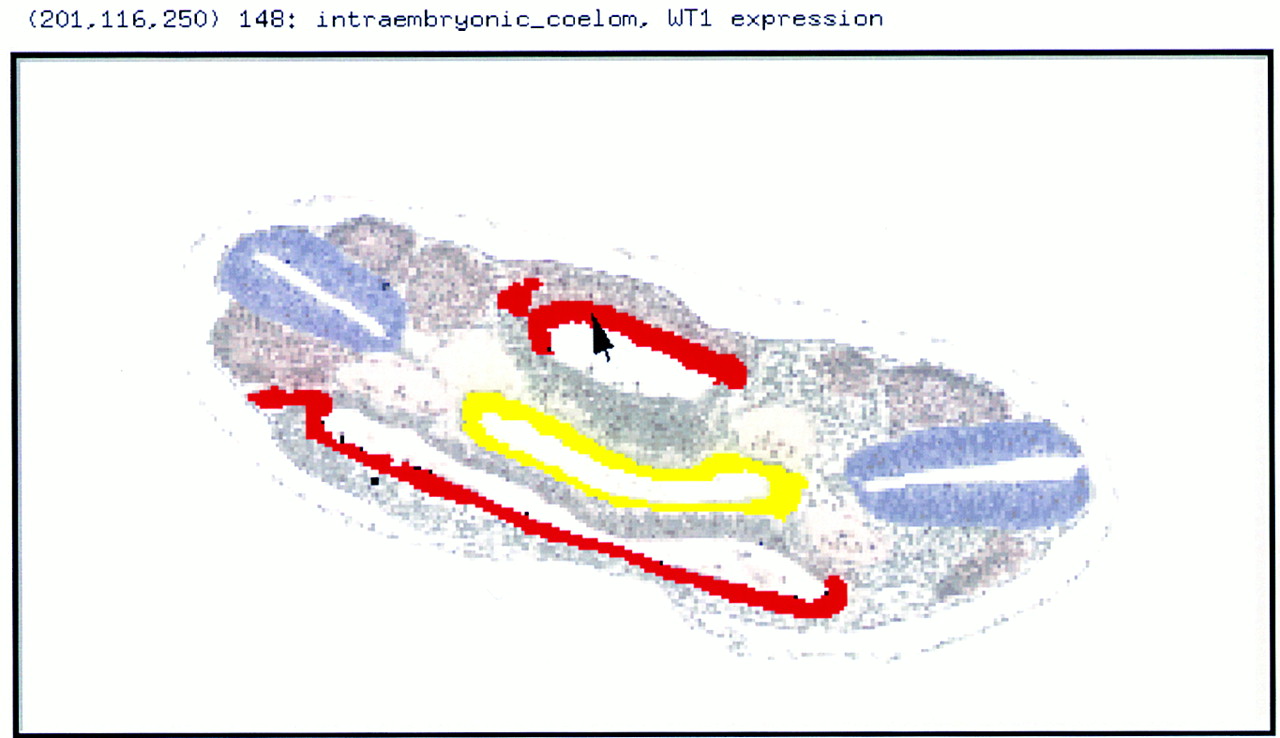
Gene expression data. A coronal section through the body region of an E14 embryo showing WT1 expression (red, data from Armstrong et al. 1992) in the lateral wall of the coelomic cavity (the presumptive mesothelium) and in the intermediate mesoderm (which has yet to segregate into nephric duct and cord—cf. with Fig. 4). Other tissues highlighted are the gut (yellow), the neural tube (blue), the somites (light brown), and the dorral aortae (very pale pink).
Producing such a database is not easy: It has to be able to handle digital reconstructions of representative embryos with all their tissues, as well as incorporate the requisite software for inputting, storing, and interrogating gene-expression data in all its complexity. Such a Graphical Gene-Expression Database (GGED; Davidson et al. 1997) is in preparation and includes an atlas of high-resolution digital reconstructions of serially sectioned embryos each of which has all its organs delineated (Figs. 2 F3 F4). These reconstructions will be provided as CD-ROMs (internet bandwidth would make browsing the data too slow), and software will be available for using the atlas on a local computer as a platform for entering data and interrogating the database. (The current status of the GGED is available at the web site; Table 1.)
The GGED will be integrated with the GXD and the DMDA so that for the user, the text and graphical databases will act as a single entity, the Mouse Gene Expression Information Resource (MGEIR). This integration means that even before the GGED contains any of its own spatially mapped gene-expression data, its atlas can be used to display and integrate the data included in the GXD on an organ-by-organ basis. The user will thus be able to ask spatial questions of the database, as well as using the 2D reconstructions for analyzing histological data and the 3D reconstructions for teaching and displaying gene-expression data (Fig. 4; Kaufman et al. 1996).
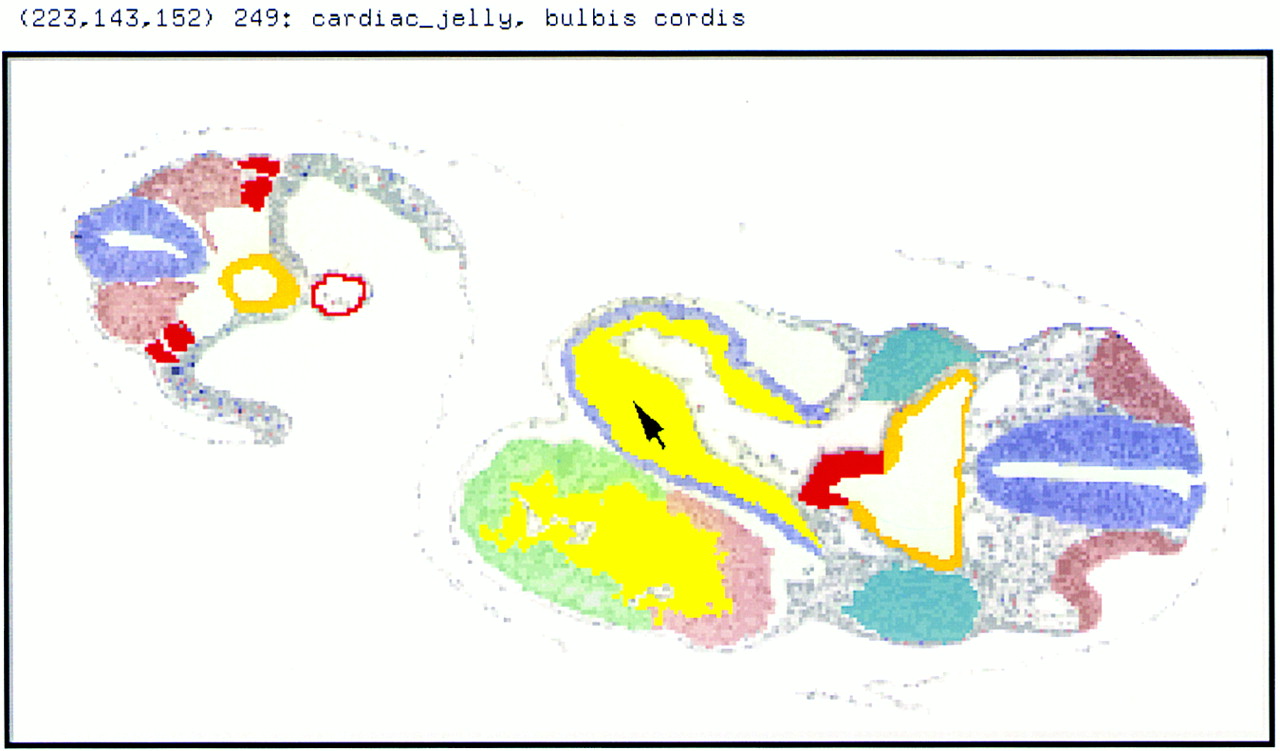
The mouse atlas. A section through a reconstructed TS14 (E9) embryo showing some key tissues. The name of the tissue to which the cursor arrow points is given in the top window (in this case, the cardiac jelly in the bulbus cordis region of the heart). Heart region [jelly (yellow), mesocardium of bulbus cordis (blue), primitive ventricle (green), common atrium (pink)]; neural tube (blue); gut (orange); thymic primordium (red); otic pit (brown). Mesoderm [second branchial arch (blue-gray), somites (pink), nephric fuct, and chord (red)]; vitelline artery (red). The lumens of blood vessels are unfilled but those of the neural tube, the gut, and the intra- and extra-embryonic coeloms are shown in pale blue.
Gene Function Data—TBase
In any developing tissues, only a subset of those genes expressed will be used in a particular genetic network. The relevant data here usually come from analyzing transgenic mice, and much of these data are stored in TBase (Table 1). This database links published phenotype and genetic data, although it does not yet have the complete repertoire of search terms provided by the DMDA and so cannot yet be fully searched in this context.
Interoperability
Gene, gene-knockout and gene-expression databases are either currently available or are planned for all the major developmental organisms (see Table 1; Bard 1997). As there is both structural and functional homology among similar genes and tissues in these organisms, we need to access all of these databases transparently to maximize our understanding of both genetic networks and evolutionary relationships (Davidson and Baldock 1997; Davidson et al. 1997).
Such access is currently difficult as the various databases are constructed in different ways and thus cannot talk to one another directly. A first step to solving this interoperabilityproblem is to build into each database a publicly available protocol allowing it to be externally interrogated. An industry standard here is the Common Objects Request Broker Architecture (CORBA; Object Management Group 1995; Orfali et al. 1996); this defines database access through a mechanism independent of machine architecture (i.e., type and operating system), and database management system, once the data semantics are standardized and global data models defined. If all database systems incorporate such a standardized interface (and the European Bioinformatics Institute has now adopted CORBA), then the possibility of true interoperability comes closer to reality. Indeed, once such common standards have been adopted, the production of general software tools for searching and handling data will become much easier.
Discussion
In one sense, the theme of this paper is “jam tomorrow” as most of the gene-expression databases mentioned here are not yet accessible. The makers, users, and funding agencies of these databases do, however, need to discuss them before they are complete to ensure that they meet future needs. Here, we briefly consider the obligations on each of these groups.
Makers
The prime requirement of any database is that it can store data and allow searches. A second requirement is that it be user friendly, and this is particularly so for gene-expression databases where the data are complex. Databases must therefore be made easy to use (Westerfield et al. 1997), and this particularly applies to data input. In the longer term, people will have to enter their own gene-expression data into these databases and will not do this if the effort is too great. One solution is the annotator facility provided by the GXD: This is an electronic notebook with a built-in anatomical infrastructure for storing data privately. When data are ready to be submitted, a submission “button” e-mails it to the database in the appropriate format. A third requirement is that databases permit interoperability—the importance of standards such as CORBA has already been emphasized.
Users
The key obligation of users is to enter their data into databases, and it is encouraging that there are now journals that publish gene-expression data in a format that will link to databases (e.g., Mechanisms of Development—Gene Expression Patterns). The willingness to enter data does, however, seem to depend on the user community: Those sequencing DNA and RNA routinely do this (journals demand it); similarly researchers using Caenorhabditis elegans, Drosophila, and zebrafish normally submit data to their well-established databases. Members of the mouse development community have yet to adopt this habit, but we hope that such data submission will become standard once the databases are in place, and that journal editors will require data entry as a prerequisite to paper acceptance.
Funding Agencies
Those who support research naturally expect results to be published in journals, but they are also beginning to demand that these results be placed in publicly accessible databases. For this to happen, these databases must be given long-term support: If interoperable databases are not properly funded, money spent on primary research may well turn out to have been wasted.
Once databases become established and filled with data, the benefits will be great. First, information now only kept in research notebooks will become generally accessible. Second, data will become available that can be electronically searched by users who had no prior idea of its existence. Third, internet-accessible bioinformatics tools, both textual and graphical, will be produced that can be used to probe the genetic basis of development. All in all, the effort of inserting data in databases seems a small price for users to pay so that the community may obtain the myriad benefits offered.
We thank our Edinburgh colleagues, Matthew Kaufman, Renske Brune and Christophe Dubreuil, together with Martin Ringwald of the Jackson Laboratory, for many helpful discussions. Our work is supported by the MRC and the Wellcome Trust.
Notes
[2] Corresponding author.
Notes
[3] E-MAIL [email protected]; FAX 44-131-650-6545.
REFERENCES
- ↵J.F. ArmstrongK. Pritchard-JonesW.A. BickmoreN.D. HastieJ.B.L. Bard(1992) Mech. Dev. 40:85–97.
- ↵J.B.L. Bard(1990) Morphogenesis: The cellular and molecular processes of developmental anatomy. (Cambridge University Press, Cambridge, UK).
- ↵(1997) Semin. Cell Dev. Biol. 8:455–458, ibid.
- ↵J.B.L. BardE. Lehtonen(1996) Sem. Cell Dev. Biol. 7:1.
- ↵J.B.L. BardM.A. KaufmanC. DubreuilR.M. BruneA. BurgerR.A. BaldockD.A. Davidson(1998) Mech. Dev. 74:111–120.
- ↵D.R. DavidsonR.A Baldock(1997) in Molecular genetics of early human development, eds T. StrachanS. LindsayD. Wilson(BIOS Scientific Publishers, Ltd. Oxford, UK).
- ↵D. DavidsonJ. BardB. BruneA. BurgerC. DubreuilW. HillM. KaufmanJ. QuinnM. StarkR. Baldock(1997) Semin. Cell Dev. Biol. 8:489–498.
- ↵D. DavidsonM. RingwaldC. Dubreuil(1998) in Guide to human genome computing, ed M. Bishop(Academic Press, London, UK), 2nd ed..
- ↵J.A. DaviesA.W. BrandliD. HunterP. Nieminen(1997) Semin. Cell Dev. Biol. 8:519–525.
- ↵M.H. KaufmanR.M. BruneR.A. BaldockJ.B.L. BardD. Davidson(1996) Int. J. Dev. Biol. 41:223–233.
- ↵Object Management Group (1995) The common object request broker architecture and specification. (OMG Publications, Framingham, MA).
- ↵R. OrfaliD. HarkeyJ. Edwards(1996) The distributed objects survival guide. (John Wiley and Sons, New York, New York).
- ↵R. RingwaldG.L. DavisA.G. SmithL.E. TrepanierD.A. BegleyJ.E. RichardsonJ.T. Eppig(1997) Semin. Cell Dev. Biol. 8:509–518.
- ↵M. WesterfieldE. DoerryA.E. KirkpatrickW. DrieverS.A. Douglas(1997) Semin. Cell Dev. Biol. 8:477–488.