Abstract
The selection of marker gene panels is critical for capturing the cellular and spatial heterogeneity in the expanding atlases of single-cell RNA sequencing (scRNA-seq) and spatial transcriptomics data. Most current approaches to marker gene selection operate in a label-based framework, which is inherently limited by its dependency on predefined cell type labels or clustering results. In contrast, existing label-free methods often struggle to identify genes that characterize rare cell types or subtle spatial patterns, and they frequently fail to scale efficiently with large data sets. Here, we introduce geneCover, a label-free combinatorial method that selects an optimal panel of minimally redundant marker genes based on gene-gene correlations. Our method demonstrates excellent scalability to large data sets and identifies marker gene panels that capture distinct correlation structures across the transcriptome. This allows geneCover to distinguish cell states in various tissues of living organisms effectively, including those associated with rare or otherwise difficult-to-identify cell types. We evaluate the performance of geneCover across various scRNA-seq and spatial transcriptomics data sets, comparing it to other label-free algorithms to highlight its utility and potential in diverse biological contexts.
The identification of marker genes plays a critical role in advancing our understanding of cellular and spatial heterogeneity at the transcriptomic level. With the continuous expansion of scRNA-seq and spatial omics data, the ability to identify informative marker gene panels has become essential for characterizing distinct cell states and their spatial distribution within tissues. These insights are fundamental for unraveling complex biological processes and for constructing comprehensive cellular atlases across various tissues and organisms.
Current approaches to marker gene selection can be broadly categorized into three types: generative, label-based, and label-free. Generative methods (duVerle et al. 2016; Lopez et al. 2018; Sun et al. 2018; Grønbech et al. 2020; Armingol et al. 2024) build statistical models of gene expression in which cell types and marker genes enter as latent variables. They typically rely on heavy computation and are not easily scalable. Label-based methods rely on predefined cell type labels to identify marker genes that differentiate between these cell types. Notable examples of such label-based methods include Seurat (Hao et al. 2021) differentially expressed gene (DEG) analysis, scGenefit (Dumitrascu et al. 2021), RankCorr (Vargo and Gilbert 2020), and CellCover (Ji et al. 2025). Although effective, these methods have inherent limitations due to their reliance on clustering-based cell type labeling or manual annotation. Clustering-based labeling typically focuses on identifying cell subpopulations that exhibit significant variability at the transcriptomic level, as principal component analysis (PCA) is often applied before graph-based clustering. This emphasis on high-variability features may obscure the detection of subtle or rare cell types, as the genes characterizing these populations often do not display dominant variability patterns. Moreover, manual annotation at single-cell resolution requires expert knowledge, making the process both time-consuming and resource-intensive.
In contrast, most existing label-free marker gene selection methods, which do not rely on predefined cell type labels, adopt an imputation-based objective. These methods aim to select gene panels that effectively recover the underlying structure of the entire transcriptome. For example, PERSIST (Covert et al. 2023) selects genes that are maximally predictive of the overall gene expression profile using a concrete autoencoder network. Similarly, SCMER (Liang et al. 2021) identifies an optimal gene set by preserving the graph structure defined by pairwise cell similarity scores. GeneBasis (Missarova et al. 2021) employs a greedy algorithm to select a gene panel that maintains the distance between the data manifold of the full transcriptome and that formed by the selected genes. Additionally, DUBStepR (Ranjan et al. 2021) uses stepwise regression on the gene-gene correlation matrix to predict the correlation matrix of the full gene set from the selected genes, iteratively regressing out the gene that explains the largest amount of variance in the residuals from the previous step. Although these imputation-based methods provide effective unsupervised solutions by selecting features that preserve the global structure of complex, high-dimensional omics data, the gene panels they produce often reflect a broad, global representation of the data, yet are less sensitive to small cell populations. This is because the data structure these methods seek to recover is predominantly influenced by genes with high variability, or, as in the case of DUBStepR, the selection process itself is driven by explained variance. Consequently, these imputation-based approaches may overlook genes that are crucial for identifying rare cell types or capturing fine spatial organization, limiting their ability to detect nuanced biological signals.
Given the preceding discussion, both label-based methods and imputation-based label-free approaches face limitations in capturing biological signatures from rare sources of variability. To facilitate the discovery of genes associated with all sources of transcriptomic variability, we introduce geneCover, a label-free correlation-based marker gene selection method designed for single-cell RNA sequencing and spatial transcriptomics data. geneCover is motivated by the observation that, within highly heterogeneous gene expression profiles, groups of genes that characterize specific cell states or spatial organizations exhibit similar expression patterns, forming unique correlation structures among the transcriptome (Ranjan et al. 2021). It highlights the potential of correlation-based methods for capturing both local and global signals by identifying distinct correlation groups formed by genes associated with rare and major cell types separately.
To capture these diverse genome-wide correlation structures, geneCover employs a minimal set-covering approach applied to the pairwise gene correlation matrix. This novel combinatorial strategy provides a globally optimal solution for the identification of minimally redundant gene panels that represent each distinct correlation structure, effectively characterizing unique spatial and cellular expression patterns at both local and global scales. By focusing on gene-gene correlations, geneCover is capable of identifying markers with subtle variations in transcriptomic activity that imputation-based methods often overlook, thereby providing a comprehensive tool for studying complex biological systems.
Methods
Notation
In the analysis of spatial transcriptomics data, each tissue section is decomposed into a collection of discrete locations, referred to as “spots,” at different cellular resolutions depending on the sequencing technology. For scRNA-seq data, each individual cell serves as the fundamental unit of analysis. To unify these concepts, we denote both spots and cells as basic units in the target data set, indexed from 1 to N. The gene expression levels across these units are represented as , where denotes the jth gene out of the total d genes, and is the expression of gene j in the ith unit. We can convert Xj to its rank representation and denote it as R(Xj), where the ith element of R(Xj) records the rank of in Xj.
Each gene j is also associated with a weight wj, reflecting the cost of its inclusion in the marker panel. To account for the gene-gene correlations, we define as a measure of the correlation between Xj and , where . By default, we will set wj = 1 for and use Spearman's correlation
Minimal-weight set covering
The minimal-weight set covering problem aims to identify a subset of genes J⊆ G that covers the remaining transcriptome while minimizing the total weights of the selected genes. Let MG,j denote the set of neighboring genes for each j ∈ G. A minimal set cover is a subset J ⊂ G of minimum cardinality such that . In other words, the covering requires each gene to belong to at least one MG,j where j ∈ J. The weighted version of the problem minimizes over all covering sets J.
Minimal weight set covering is a classical problem in combinatorial optimization (Balas and Padberg 1972) and can be formulated as an integer programming problem. Introduce the binary vector , where uj = 1 indicates that gene j ∈ G is selected for the marker panel. Given the thresholding parameter λ, the integer programming formulation is
Refinement and size adjustment
The optimal solution JG(λ) obtained from the integer programming formulation includes genes that only cover themselves, that is, j ∈ JG(λ) if . However, genes that correlate only with themselves or with few other genes often exhibit noisy expression patterns and contribute limited biological insight. To increase the robustness of our marker panel, we exclude genes j ∈ JG(λ) that cover fewer than m genes where m > 1. The final marker gene panel is thus refined as
Expansion
One may also wish to expand the marker panel to capture a broader set of genes representing multiple genes from each correlated gene group. Because minimal set covering identifies a compact set of genes that characterize distinct correlated gene groups, we can expand the panel by iteratively selecting additional genes from these groups. To achieve this, at each iteration t + 1, we remove the latest optimal marker panel from the set of genes considered in the previous iteration Gt and then run the minimal set covering on the remaining genes with marker panel refinement to identify a new panel of preselected size that captures additional genes from the remaining correlated gene groups. Because each iteration is performed on the reduced gene set, this process may also uncover new correlated gene groups that were not prioritized in earlier iterations, thereby providing a more comprehensive representation of gene expression variability. The expanded marker panel is obtained by repeating this process over multiple iterations until the desired panel size or coverage is achieved.
geneCover algorithm
The geneCover algorithm takes as input the whole-transcriptome gene-gene correlation matrix ρ ∈ ℝd×d, a positive weight vector , a target subset of the transcriptome , the marker panel refinement parameter m, and the preselected marker panel size k or a nonnegative sequence of sizes {kt}1:T for successive expansions. It is fully described in Algorithm 1.
1 procedure GeneCover(k,ρ,w,G,m)
2 , λmin = 0, λmax = 1
3 while |J*| ≠ k do
4 λ = (λmin + λmax)/2
5 binarize ρG with threshold λ
6 u = MinimalSetCover solve the integer programming formulation
7
8 if |J*| < k then
9 λmax = λ
10 else
11 λmin = λ
12 Return J*
13 procedure Iterative-GeneCover()
14 for t = 1:T do
15 GeneCover(kt,ρ,w,G,m)
16
17
18 Return J*
Results
To systematically evaluate the performance of geneCover, we applied our method across a range of distinct biological systems captured by both scRNA-seq and spatial transcriptomics data sets from multiple protocols (see Supplemental Methods for details of data set processing and marker panels generation from other label-free methods):
The DLPFC data set (Maynard et al. 2021) offers spatial mapping of gene expression across the six layers of the human dorsolateral prefrontal cortex using the 10x Genomics Visium platform. With manual histological layer annotation, this data set is commonly used as a benchmark for evaluating spatial transcriptomics methods.
The CBMC CITE-Seq data set (Stoeckius et al. 2017) is a multimodal single-cell analysis derived from cord blood mononuclear cells (CBMCs). It combines cell-surface protein expression with transcriptomic data, offering a rich source of immune cell population information in the cord blood system. For our analysis, we focus exclusively on RNA expression data.
The mouse brain Visium HD data set (10x Genomics 2024) is derived from an FFPE brain tissue block of an 8 week-old male mouse, providing a high-resolution, whole-transcriptome spatial mapping of multiple brain regions.
The scFFPE breast cancer data set (Janesick et al. 2023) provides a detailed molecular characterization of breast cancer, identifying 15 distinct cell types to improve understanding of tumor progression and immune interactions.
The IFNB single-cell RNA sequencing data set (Kang et al. 2018) is a multiplexed droplet-based transcriptomic analysis of peripheral blood mononuclear cells, in which cells were either stimulated with interferon beta or left untreated.
The following sections present an experimental evaluation of geneCover. First, we compare geneCover with other leading label-free marker gene selection methods on the DLPFC data set, demonstrating its effectiveness in identifying spatially organized gene expression patterns. Next, we illustrate that geneCover enhances the resolution of single-cell and spatial transcriptomic discoveries, focusing on its ability to uncover nuanced cell types and spatial organizations in the CBMC, mouse brain Visium HD, and scFFPE breast cancer data set. We then discuss the scalability of geneCover, showcasing its ability to efficiently handle large data sets. Following this, we analyze the robustness of geneCover's hyperparameter selection, evaluating the stability of our clustering results across different hyperparameter settings. Lastly, we introduce a generalized geneCover framework that enables marker gene selection across multiple samples or conditions, highlighting its ability to identify conserved cellular programs. To demonstrate its utility, we apply this generalized framework to the DLPFC data set—jointly identifying layer-specific marker genes across donors—and to the IFNB single-cell data set, where we show enforcing cross-condition coverage uncovers additional marker gene robustness overlooked by vanilla geneCover.
Relative performance in recovering cell identities
To benchmark the performance of geneCover against other label-free gene selection methods, we conducted an experiment using the DLPFC data set (sample #151673). We compared geneCover with five other methods: geneBasis, PERSIST, SCMER, and DUBStepR, which are label-free imputation-based marker gene selection methods, as well as Highly Variable Genes (HVGs). For each method, we obtained marker gene panels from the gene expression profile of the DLPFC data set and restricted the log-normalized count matrix to the selected genes. We then performed principal component analysis, retaining 50 principal components based on these gene panels. To assess the clustering performance, we applied the Leiden (Traag et al. 2019) algorithm in SCANPY (Wolf et al. 2018) with default parameters to these principal components across 30 clustering random seeds and computed the average normalized mutual information (NMI) between the resulting clusters and the manually annotated histological layers. This benchmarking procedure allowed us to quantify how well each method's marker gene panel could recover the histological structure of the prefrontal cortex.
The results indicate that geneCover consistently performs at similar or higher levels compared to other methods across different marker panel sizes, with geneBasis being the closest competitor (Fig. 1A–C). Specifically, geneCover maintains this performance advantage across different marker panel sizes, demonstrating its robustness and effectiveness in recovering spatially organized structures in the DLPFC.
Benchmarking performance of geneCover and competing methods on the DLPFC data set. To obtain the geneCover marker panel, we apply Iterative-GeneCover in Algorithm 1 with parameters: {kt}1:T = {100, 100, 100, 100, 100}, m = 3. (A) NMI versus the size of the marker gene panel for all label-free methods. (B) Manually annotated histological layers of the DLPFC. (C) Leiden clusters obtained using 500 genes selected by each method with the same random seed. (D) Expression of selected marker genes from geneCover.
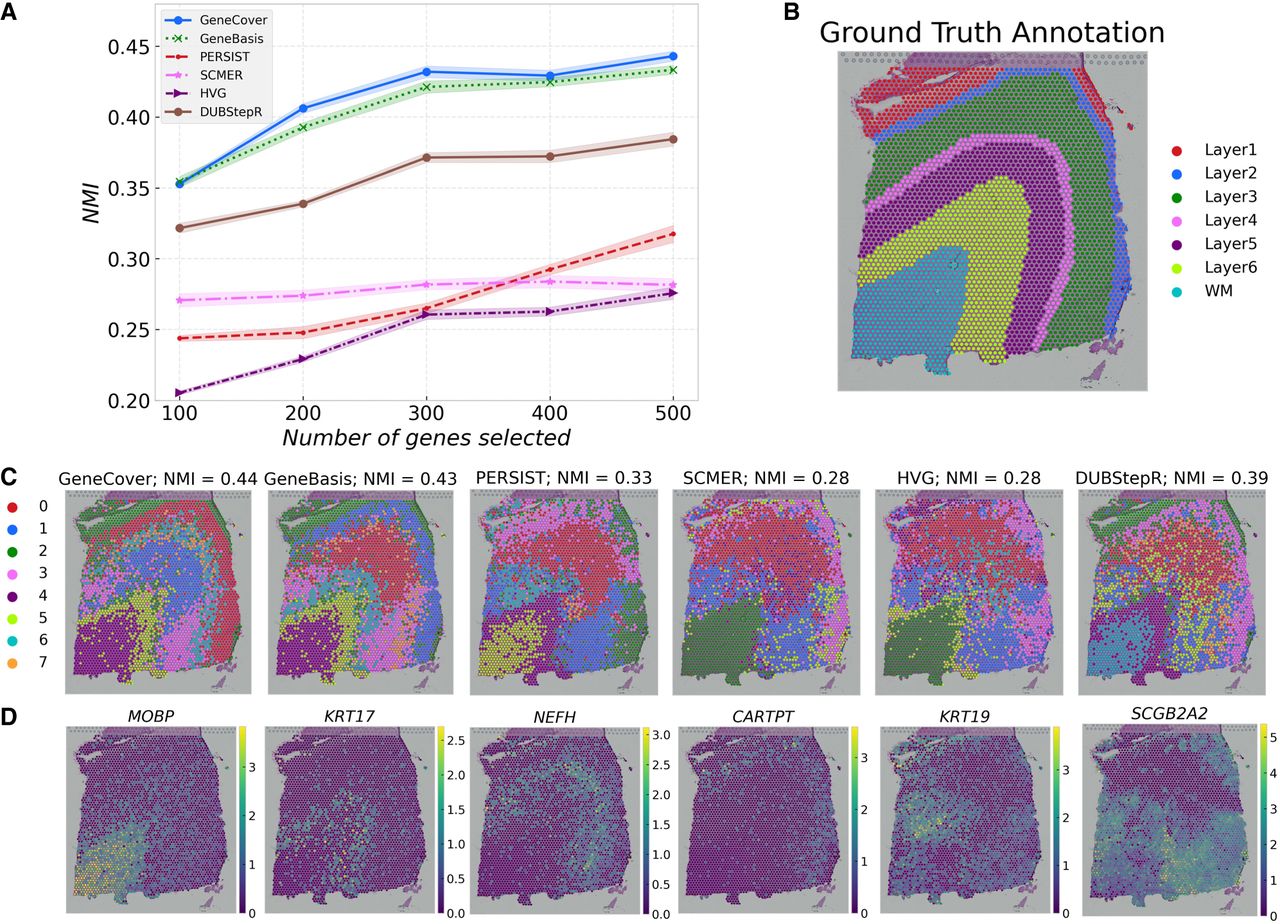
Despite being a label-free method, geneCover is able to identify layer-enriched signals that closely align with the manually annotated layers in the DLPFC data set. For example, in Figure 1D, the white matter region is predominantly defined by the geneCover marker MOBP. KRT17 shows higher expression in layer 6, whereas the elevated expression of NEFH marks the boundary between layer 3 and 4. Likewise, layer 3 is enriched for CARTPT, and KRT19 is highly expressed in layer 1. These findings highlight geneCover's ability to detect biologically meaningful signals even without predefined labels. Additionally, as label-free marker gene selection methods like geneCover identify genes from all sources of variability, some genes may capture biological processes that are not directly associated with anatomical structures. For instance, we observe that SCGB2A2 is the most differentially expressed gene in Cluster 3. Interestingly, its expression shows spatial variability, even though it does not correspond to any of the annotated layers.
In summary, the benchmark analysis validates the effectiveness of geneCover in recovering biologically meaningful structures in spatial transcriptomics data. Its performance underscores its potential for providing more accurate and biologically relevant insights into additional spatial transcriptomic and scRNA-seq data.
geneCover improves resolution in single-cell and spatial transcriptomics discovery
CBMC
In this section, we highlight how geneCover discovers a minimally redundant set of highly specific marker genes that characterize the diverse cell types in the CBMC data set. When restricting the marker panel to 50 genes for each method, geneCover identifies a minimally redundant set of genes that effectively captures the diverse cellular architecture within the cord blood data set. Figure 2, A and C (Supplemental Fig. S1A–C) show the Spearman's correlation matrices for the first 50 genes identified by geneBasis and geneCover (SCMER, PERSIST, DUBStepR), respectively, with genes reordered using hierarchical clustering. Notably, geneCover identifies a more distinct set of correlated gene groups, as indicated by more and clearer diagonal blocks in Figure 2A compared to Figure 2C. Moreover, the correlated gene groups identified by geneCover are visibly smaller, indicating its ability to reduce redundancy through the minimal set-covering approach. We also observe that geneCover selects significantly fewer redundant marker genes for certain cell populations. For example, whereas SCMER, PERSIST, DUBStepR, and geneBasis identify multiple highly correlated markers for the mouse cell population, geneCover selects only the MYL3 gene to represent this group. This highlights how geneCover efficiently explores the complex correlation structures within the omics data and selects a nonredundant set of marker genes.
geneCover identifies a minimally redundant set of marker genes characterizing diverse cell types in the CBMC data set. To obtain the geneCover marker panel, we apply Iterative-GeneCover in Algorithm 1 with parameters: {kt}1:T = {50, 50, 50, 50, 50, 50, 50, 50, 50, 50}, m = 6. (A) Spearman's correlation heat map of the 50 geneCover marker genes identified by geneCover, with gene reordered by hierarchical clustering. (B) Expression matrix of geneCover markers, with same ordering as in A, in cell types. Gene expression is standardized to [0, 1] range. The color intensity represents the level of the normalized expression. (C) Same as A but for geneBasis markers. (D) Same as B but for geneBasis markers. (E) NMI versus marker panel size for different label-free methods. (F) Specificity score versus marker panel size for different label-free methods. Lower score indicates better marker specificity.
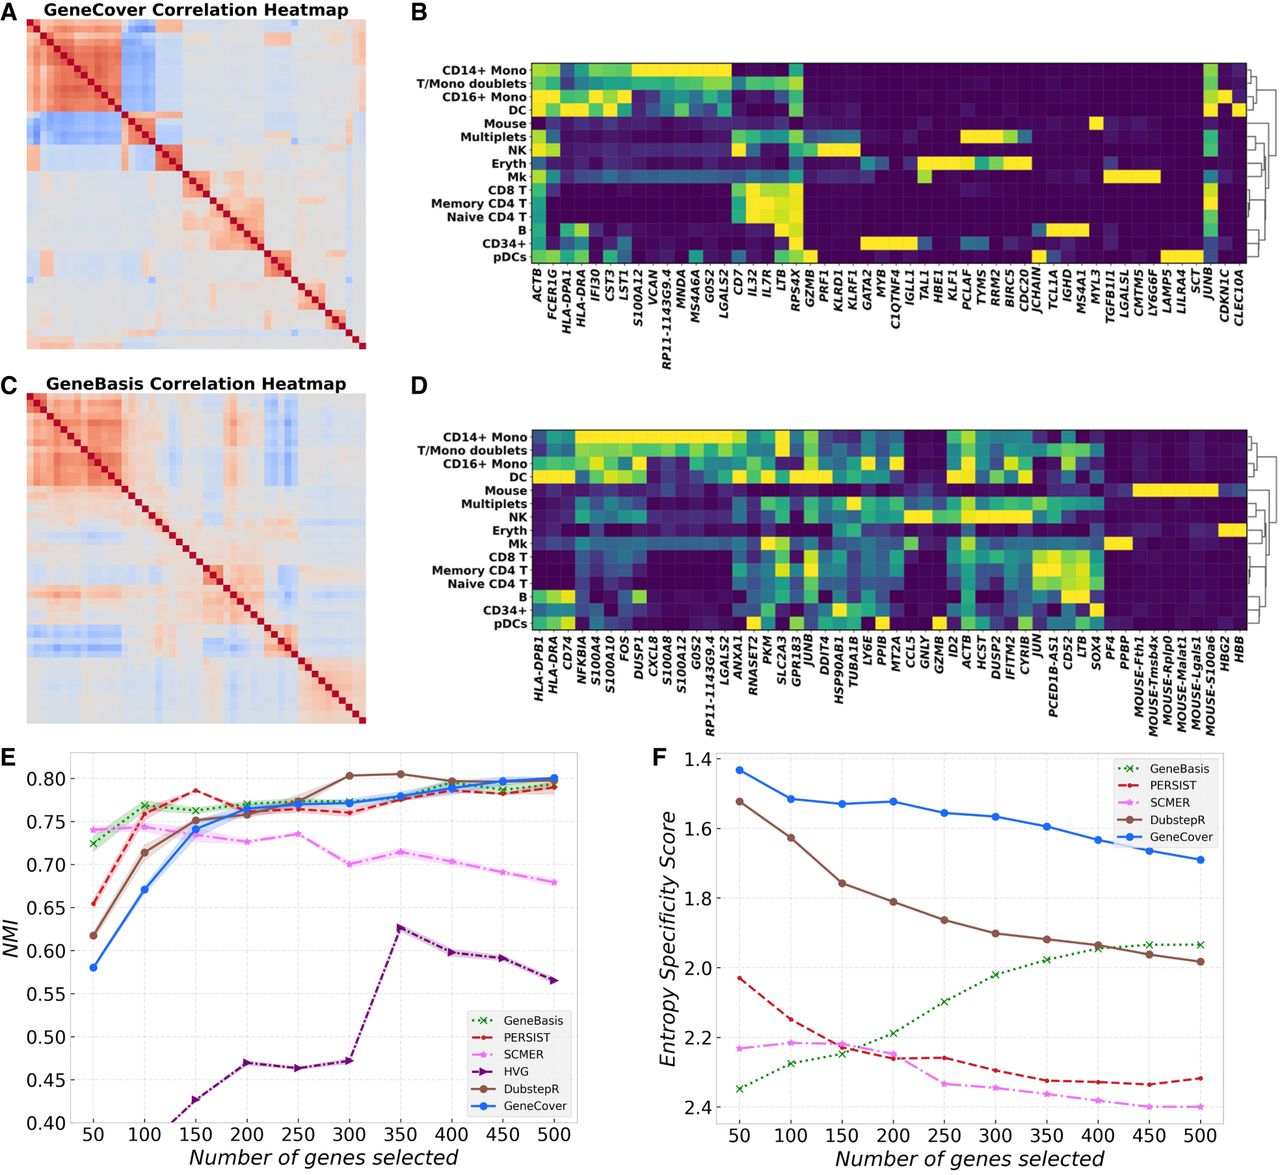
With the ability to capture diverse cellular landscapes, geneCover markers can effectively resolve cell states within the CBMC data set. Using a similar comparison procedure as in the previous subsection, we find that geneCover aligns with the top-performing methods in recovering cell types (Fig. 2E). The normalized mutual information scores for geneCover grow steadily with the marker panel sizes, and they are comparable to geneBasis, DUBStepR, and PERSIST.
Although these methods achieve similar performance in cell type recovery, they exhibit notable differences in marker gene characteristics. Figure 2F illustrates that geneCover markers are the most specific to individual cell types among all imputation-based methods across all marker panel sizes based on the specificity score (see Supplemental Methods), whereas the markers from other imputation-based methods are more broadly expressed across multiple cell types but less informative about the cell types. To illustrate, in the size-50 panel (Fig. 2B), geneCover identifies CDKN1C as uniquely characterizing the CD16+ Mono cell type, and CLEC10A is exclusively expressed in DC cells. In contrast, the markers identified by geneBasis tend to favor widely expressed genes with broader variation patterns, as demonstrated by the diffused cell type expression pattern in the matrix plots (Fig. 2D). Although this selection may improve clustering accuracy—because geneBasis achieves strong performance with 50 markers (Fig. 2E)—it does not summarize a rich portfolio of cell type–specific expression patterns, potentially limiting deeper biological insights.
Notably, geneCover is also capable of distinguishing hierarchical gene expression patterns. For example, PCLAF is expressed in both the multiplets and erythroid cell populations, whereas KLF1 is uniquely expressed in erythroid cells (Fig. 2B). Even though PCLAF encompasses the expression pattern of KLF1, geneCover is still able to distinguish these two gene groups with overlapping yet distinct correlation structures.
Mouse brain Visium HD
We demonstrate that geneCover can effectively resolve hippocampal subfields in the mouse brain. We selected 200 marker genes using geneCover, geneBasis, and DUBStepR and applied the Leiden clustering algorithm on the cell-neighborhood graphs generated from the expression profiles restricted to these marker genes (Fig. 3A,B). Here, we avoid using principal components, which could downplay the contribution of marker genes that characterize spatial organization with very low abundance. As a comparison, we also applied the conventional clustering pipeline using 200 principal components of the entire transcriptome, followed by Leiden clustering (Fig. 3C). To ensure a fair comparison, we adjusted the Leiden clustering resolution for each method so that all pipelines produced 15 clusters, matching the number of clusters provided by 10x Genomics (2024). The resolution parameter controls the coarseness of clustering, where higher values lead to finer subdivisions and more clusters. The average resolutions over five random seeds were 0.99 for geneCover, 1.62 for geneBasis, 1.30 for DUBStepR, and 1.06 for the conventional pipeline. Notably, geneCover required the lowest resolution to achieve 15 clusters, which may suggest that the selected gene panel captures a diverse range of expression patterns, facilitating natural partitioning of the data.
geneCover resolves hippocampal subfields in the mouse brain. To obtain the geneCover marker panel, we apply Iterative-GeneCover in Algorithm 1 with parameters: {kt}1:T = {80, 60, 60}, m = 3. (A) Leiden clusters learned from 200 geneCover markers, with a highlight of clusters in the CA1–CA3 subiculum and dentate gyrus regions. (B) Same as panel A but for 200 geneBasis markers. (C) Same as panel A but for 200 principal components from the whole transcriptome. (D) Legend for clusters in panels A, B, and C. (E) Differentially expressed geneCover markers for geneCover clusters 10, 11, and 12. (F) Four graph-based clusters provided by 10x Genomics with the lowest cell abundance. (G) Comparison of geneCover and geneBasis in resolving rare spatial organization in the mouse brain.
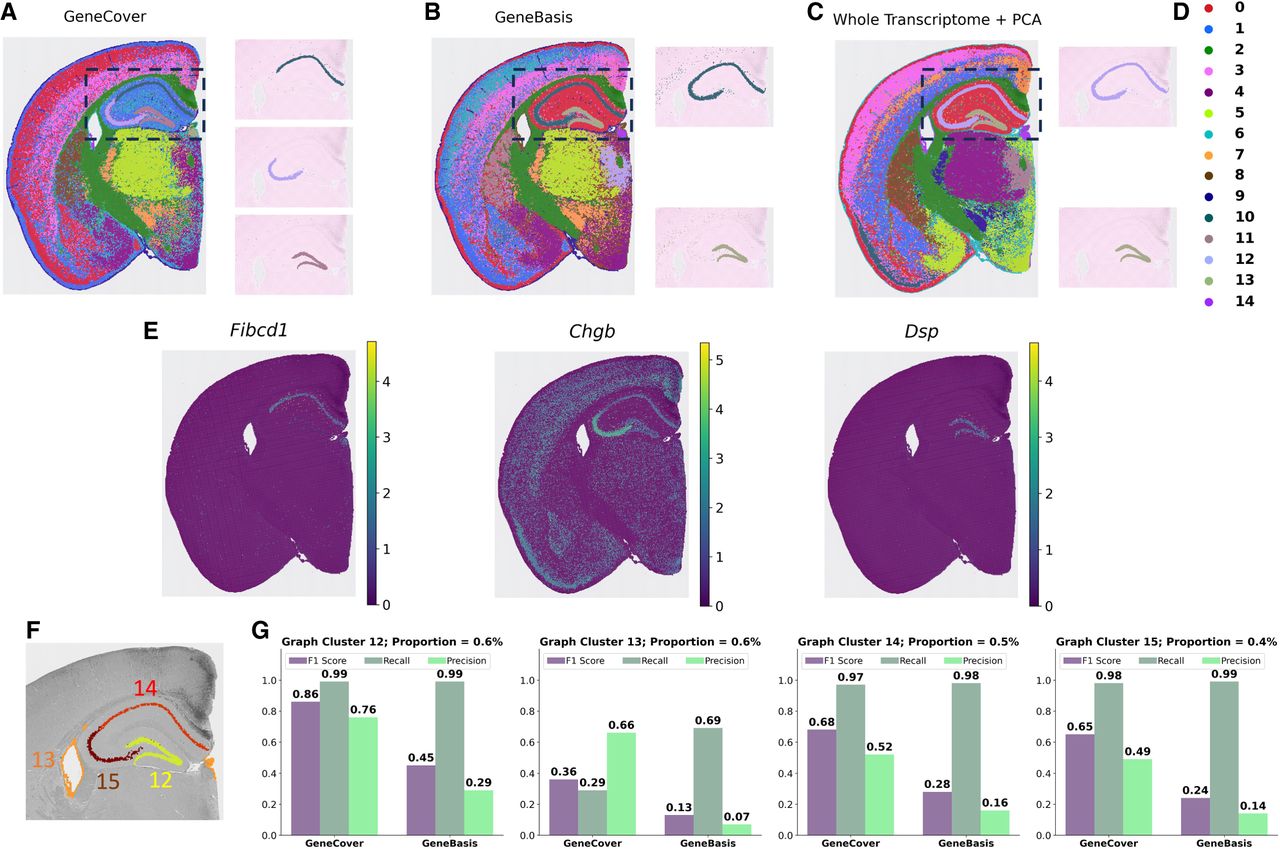
Whereas all methods manage to identify the dentate gyrus, characterized by the marker Dsp (Fig. 3E), in the mouse brain, geneCover uniquely divides the CA1–CA3 subiculum into two distinct regions (Fig. 3A; Supplemental Fig. S2A). However, none of geneBasis, whole-transcriptome + PCA, and DUBStepR is capable of resolving this important hippocampal subregion, regardless of the random seeds used for clustering (Supplemental Fig. S2B–D). Even with increased clustering resolution, geneBasis and DUBStepR markers still struggle to segregate the area (Supplemental Fig. S3). This distinction is significant, as the CA1–CA3 subiculum plays a crucial role in hippocampal function, contributing to memory formation and spatial navigation. Importantly, the two clusters identified by geneCover are transcriptionally distinct, as evidenced by the marker genes within the geneCover panel (Fig. 3E). Fibcd1 expression is uniquely localized to geneCover cluster 10 (Fig. 3A [top right], D), which corresponds to the first division of the CA1–CA3 subiculum, whereas Chgb shows the highest expression in cluster 12 (Fig. 3A [middle right], D), representing the second division of the CA1–CA3 subiculum. Region-specific signals representing the division of CA1–CA3 are primarily detected by geneCover, whereas geneBasis and DUBStepR fail to capture many of these signals. We selected multiple marker genes differentially expressed between the two divisions: Fibcd1, Spink8, Iqgap2, and Lefty1 for the first division, and Chgb, Dnm1, Slc17a7, and Snap25 for the second division. Based on Supplemental Figure S4 (rows 1–3), geneBasis fails to detect any markers for the first division, whereas DUBStepR identifies only Fibcd1. In contrast, geneCover successfully captures Fibcd1, Spink8, and Iqgap2. For the second division, although all three methods identify Dnm1, Slc17a7, and Snap25, the most region-specific signal, Chgb, is uniquely detected by geneCover. The abundance of these region-specific markers in the geneCover panel facilitates the identification of these highly refined spatial organizations.
To further quantify how well geneCover resolves these delicate spatial organizations, we compared its performance to geneBasis using the 15 graph-based clusters provided by 10x Genomics (Supplemental Fig. S5) as a reference. We focused specifically on four reference clusters with the smallest cell abundances (clusters 12–15 in Fig. 3F), each comprising <1% of the total cell population. We matched clusters from geneCover and geneBasis to the 10x Genomics clusters using the F1 score (see Supplemental Methods). According to Figure 3G, the clusters identified by geneCover consistently demonstrate better matching qualities with the four rarest reference 10x Genomics clusters based on F1 score (see Supplemental Fig. S6 for matching quality comparisons on all 10x Genomics reference clusters). This result highlights geneCover's ability to enhance the resolution of spatial transcriptomics discovery, particularly in identifying highly refined spatial organizations, using a compact and minimally redundant set of genes.
scFFPE breast cancer
geneCover markers facilitate the identification of a transcriptionally distinct immune cell subpopulation that was absent from the original cell type annotations in the scFFPE breast cancer data set. Specifically, within the originally labeled Macrophage 1 cell population (Fig. 4A), geneCover uniquely identifies a subpopulation (Fig. 4C,D, cluster 12) using 300 markers, a distinction that geneBasis struggles to achieve (Fig. 4B; Supplemental Fig. S7). Moreover, we demonstrate that geneCover can reliably identify this potential immune subpopulation even with marker panels reduced to 100 or 200 genes. This performance remains robust across different random seeds used for clustering (Supplemental Fig. S8).
geneCover markers facilitate the identification of a transcriptionally distinct immune cell subpopulation in breast cancer. To obtain the geneCover marker panel, we apply Iterative-GeneCover in Algorithm 1 with parameters: {kt}1:T = {100, 100, 100}, m = 3. (A) UMAP visualization of cell type annotations provided by the data set, with a zoom-in on the Macrophage 1 and Macrophage 2 subpopulations. (B) Data-driven Leiden clusters learned from 300 geneBasis markers using the standard pipeline. (C) Same as panel B, but for 300 geneCover markers. (D) Legend for the clusters in panels B and C. (E) Differentially expressed genes for geneCover Cluster 12.
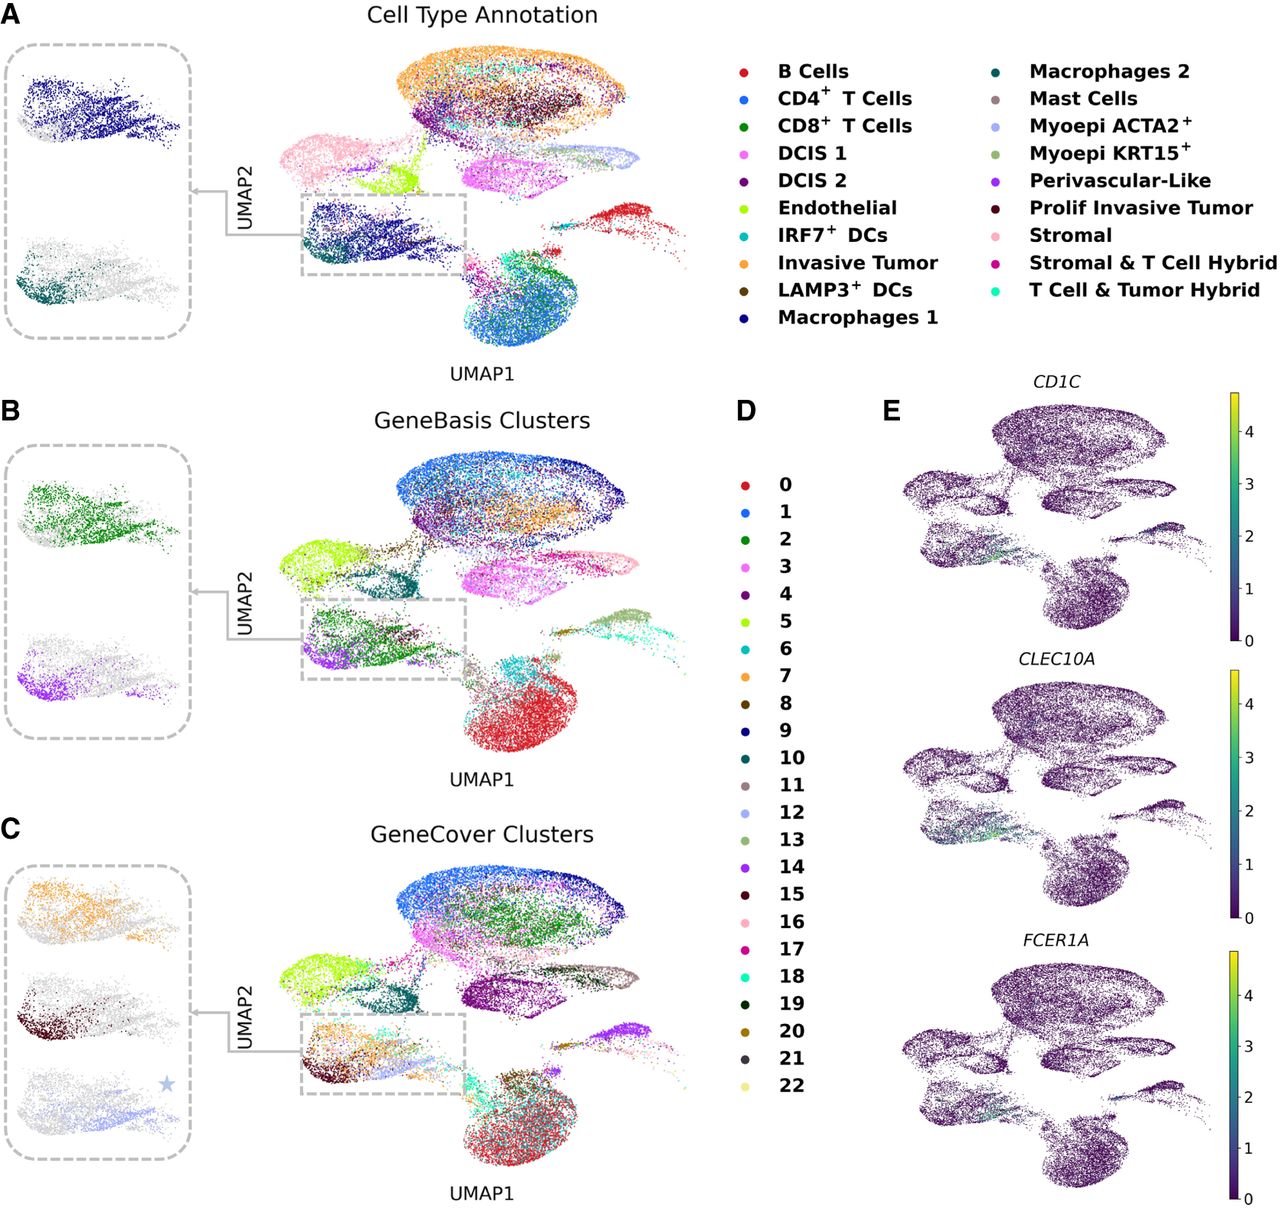
Based on differential expression analysis of geneCover cluster 12, we hypothesize that this immune cell population may be related to dendritic cells, as geneCover identifies CD1C, CLEC10A, and FCER1A (Fig. 4E), which are all well-established markers of dendritic cells. CD1C is a marker of conventional dendritic cells type 2 (cDC2), which are crucial for presenting antigens and initiating immune responses. CLEC10A is specifically expressed on CD1C+ dendritic cells, enhancing their cytokine secretion in response to toll-like receptor stimulation, which contributes to their role in immune surveillance (Heger et al. 2018). Notably, CLEC10A is also identified by geneCover in the CBMC data set, where it is exclusively expressed in dendritic cells (Fig. 2B, the last gene). Lastly, FCER1A encodes the alpha chain of the high-affinity IgE receptor, which is expressed on dendritic cells and plays a critical role in mediating allergic responses by promoting antigen presentation and activation of immune cells in response to IgE-bound allergens (Prussin et al. 2003). Together, the identification of these marker genes suggests that the transcriptionally distinct immune cell subpopulation uncovered by geneCover may represent a previously unrecognized subset of dendritic cells within the tumor microenvironment.
The ability of geneCover to enhance the resolution of omics data analysis offers the potential for novel hypotheses regarding subtle cell types, shedding light on cell populations that may have been overlooked in previous studies.
Scalability
In this section, we demonstrate the scalability of geneCover when applied to large omics data sets. As shown in Table 1, geneCover significantly outperforms other label-free marker gene selection methods in terms of run time across the four data sets of consideration. Here, we include only label-free methods that allow the specification of marker panel size.
Empirical run time of label-free marker gene selection methods on omics data sets
| DLPFC | CBMC | scFFPE BC | Mouse brain | |
|---|---|---|---|---|
| geneCover | 22.1 sec | 18.3 sec | 35.4 sec | 134.7 sec |
| geneBasis | 515.4 sec | 2193.2 sec | 17.5 h | 93.8 h |
| SCMER | 241.6 sec | 1961.4 sec | 2.4 h | 18.2 h |
| PERSIST | 3.8 h | 7.5 h | 5.5 h | N/A |
[i] The time is measured in either seconds (sec) or hours (h). For each method, we obtained 100 markers for the DLPFC and CBMC data sets, 300 markers for the scFFPE breast cancer data set (, for geneCover), and 200 markers for the mouse brain Visium HD data set (, for geneCover). geneCover and geneBasis were run using the Intel Core i9 13900K CPU, whereas SCMER and PERSIST were run on the NVIDIA GeForce RTX 4090 GPU. (N/A) memory overflow.
In particular, for the mouse brain Visium HD data set, which contains approximately 100,000 bins, geneCover completes its task in just 134.7 sec, making it approximately 500 times faster than the runner-up, SCMER, which requires 18.2 h. Additionally, geneBasis takes over 93 h to generate the marker panel, and PERSIST is unable to handle the data set due to memory overflow, regardless of the various batch sizes tested. Furthermore, iterative geneCover provides a scalable solution even when a much larger gene panel size is required. To illustrate, we applied the algorithm to all four data sets and gradually increased the gene panel size by 100 at a time, reaching a final panel size of 1000 genes. geneCover returns the solution in <3 min for all four data sets (Supplemental Fig. S9).
The observed scalability of geneCover can be attributed to its focus on gene-gene correlations. The most computationally intensive step is the calculation of the correlation matrix, which scales with the number of cells. However, this step can typically be executed efficiently using parallel computing. More importantly, because the input dimension for the minimal set covering problem is determined solely by the number of genes, the run time of the set covering algorithm remains invariant to the number of cells and depends only on the number of genes being considered. In contrast, the three imputation-based methods have time complexities that scale with both the number of cells and the number of genes. As a result, their run times increase considerably as the data set size grows, making them significantly slower on large-scale data sets.
However, we acknowledge that geneCover's runtime efficiency may be compromised when the required (incremental) marker panel size, kt, is too large. This limitation arises fundamentally from the reduction of the correlation threshold λ as kt increases (Supplemental Fig. S10). For instance, in the DLPFC data set, when λ falls below 0.09—which corresponds to requiring kt > 1600 in a single run of geneCover—the algorithm is no longer able to return the optimal solution within a few seconds. This occurs because a lower λ leads to an increase in gene neighborhood size, thereby expanding the coverage capacity of all genes. Consequently, the number of feasible covering sets may grow significantly, prolonging the search for an optimal solution. Furthermore, a lower λ introduces greater overlap among gene neighborhoods, which can obscure the distinction of the genome-wide correlation structure. To address this, if a large gene panel is required, we recommend using iterative geneCover with a properly chosen step size to gradually expand the gene set. Compared to obtaining all selected genes in a single run, this approach not only ensures efficient run time but also enables genes to be sequentially selected from distinct correlated gene groups, thereby capturing diverse signals that characterize the cellular landscape.
Robustness to hyperparameter selection
To assess the robustness of geneCover's ability to resolve fine-grained spatial organizations, we examined the impact of hyperparameter selection on its clustering performance of the mouse brain Visium HD data set (10x Genomics 2024). Specifically, we evaluated how variations in key parameters—the gene neighborhood size threshold (m) and the sequence of incremental sizes ({kt}1:T)—affect the resolution of spatial structures. First, we fixed {kt}1:T = {80, 60, 60}, as used in the previous analysis, and gradually increased m. Despite requiring each selected marker to cover more genes, the geneCover marker panel still retains a substantial number of region-specific signals that characterize the two CA1–CA3 subdivisions (Supplemental Fig. S4, rows 4–9), allowing these highly refined regions to remain identifiable by Leiden clustering even with m = 30 (Supplemental Fig. S11A). This seemingly counterintuitive result can be explained by the self-adjusting nature of the algorithm: given the fixed {kt}1:T, as m increases, the final correlation threshold λ determined by the binary search decreases (Supplemental Fig. S12), allowing each selected marker to cover a broader set of genes. Thus, even though a stricter coverage requirement is imposed, the increase in gene neighborhood sizes ensures that genes capturing fine-grained spatial structures will be preserved in the covering panel.
Secondly, we fixed m = 3 and varied {kt}1:T to generate a geneCover panel of size 200. We found that the CA1–CA3 subregion could be successfully segregated using a geneCover panel generated with fewer iterations ({kt}1:T = {100, 100}) (Supplemental Fig. S11B). However, as T increases beyond 3, Leiden clustering fails to detect this division ({kt}1:T = {50, 50, 50, 50}, {kt}1:T = {40, 40, 40, 40, 40}) (Supplemental Fig. S11B). This behavior arises because larger T values require smaller kt, increasing the final λ at each iteration. As a result, the selected markers exhibit strong correlations with the genes they cover, and they primarily capture broad variability patterns rather than finer-scale biological distinctions. This suggests that small-size coverings may not include enough highly specific genes crucial for detecting certain subregion differences. Indeed, increasing T while fixing the total gene panel size results in the loss of some differentially expressed genes that define the CA1–CA3 segregation (Supplemental Fig. S4, rows 11–12), particularly Chgb, which characterizes the second division of CA1–CA3. However, we observe that these lost signals can be restored by expanding the marker panel beyond the fixed size of 200 through additional iterations. For example, with one additional iteration ({kt}1:T = {50, 50, 50, 50, 50}), selected differentially expressed genes distinguishing the two subdivisions—Fibcd1, Spink8, Iqgap2, Lefty1 for the first division and Chgb, Dnm1, Slc17a7, Snap25 for the second—are all successfully identified by geneCover (Supplemental Fig. S4, row 13). Similarly, setting kt = 40 for t = 1, …, 6 to extend the panel to 240 genes restores Fibcd1 and Spink8, as well as Chgb in the expanded panel (Supplemental Fig. S4, row 14).
To summarize, across a range of reasonable hyperparameter choices, geneCover retains a substantial proportion of region-specific signals, enabling highly refined tissue organization to remain identifiable by Leiden clustering. However, we find that overly fragmented coverings (small kt) may limit the resolution of biological signals under our clustering pipeline. This effect is naturally mitigated as the panel expands with additional iterations, allowing geneCover to sequentially incorporate a broader set of correlation structures within the transcriptome.
Marker gene selection across samples and conditions
To identify robust biological signals that characterize conserved cellular programs, we can naturally extend geneCover to enable marker gene selection across multiple samples and conditions. In this generalized formulation, we require every gene in the transcriptome G to be covered by at least one of the selected marker genes in all samples or conditions.
Let B denote the set of samples or conditions and let be the binary adjacency matrix determined by gene-gene correlations within each sample b ∈ B. The generalized integer programming formulation is given by
We applied the generalized geneCover to extract marker genes that characterize shared tissue organization of the human dorsolateral prefrontal cortex across three DLPFC samples—#151507, #151669, and #151673—collected from different donors (Fig. 5A). A subset of the selected marker genes—MOBP, KRT17, PCP4, NEFH, CARTPT, HPCAL1, and VIM—exhibits strong layer-specific expression patterns (Fig. 5B), covering Layers 1 through 6 and the white matter. Figure 5C–E further confirms that the expression of each gene is concentrated within distinct laminar regions across all three tissue sections, providing evidence that these genes robustly mark their respective layers.
geneCover marker selection across three samples of the DLPFC data set. We apply generalized iterative geneCover with {kt}1:T = {100, 100, 100}, m = 3. (A) Annotated histological layers of three DLPFC tissue samples. (B) Normalized expression matrix of the selected geneCover markers across different layers in each sample. (C) Spatial expression (in log counts) patterns of the selected markers in sample #151507. (D) Same as C for sample #151669. (E) Same as C for sample #151673.
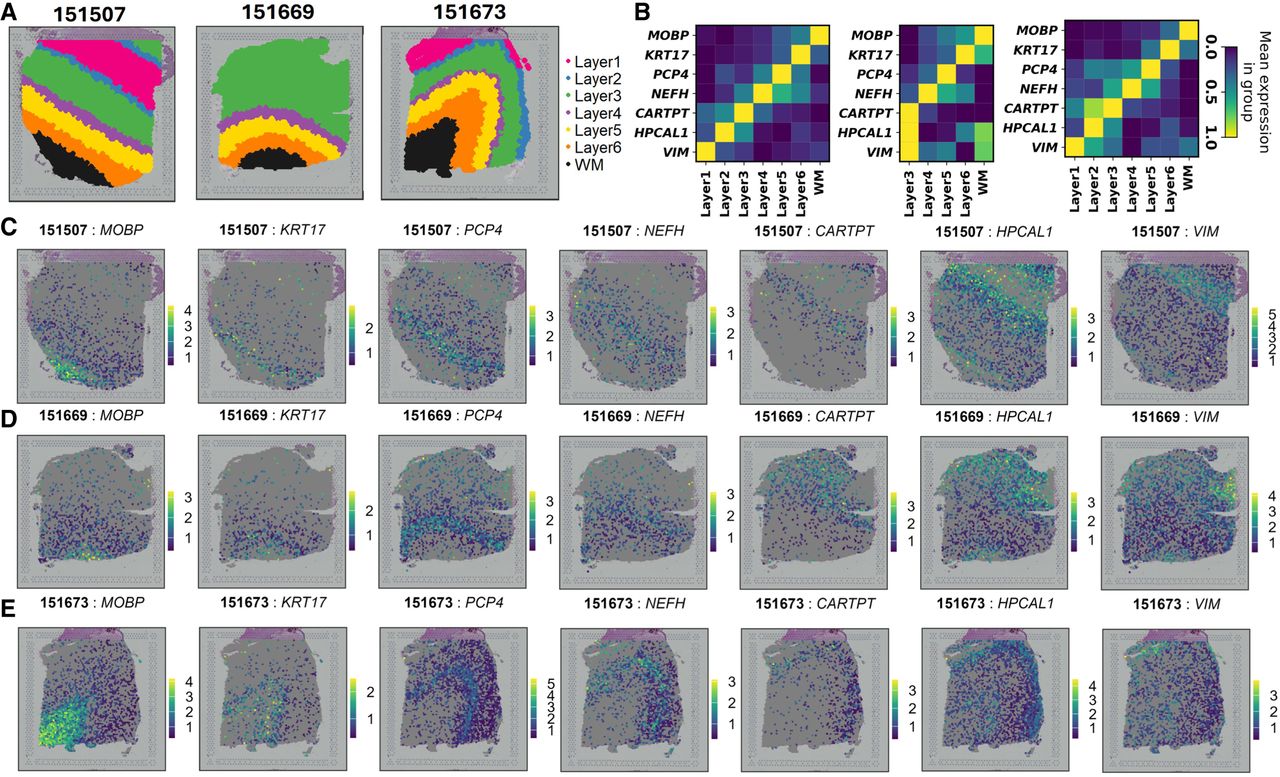
Additionally, their spatial expression patterns illustrate a progressive transition across cortical layers. According to Figure 5C–E, from left to right, the regions with predominant expression shift from the white matter to the outer cortical layers, reflecting a structured gradient in the human cortex. Notably, although Layers 1 and 2 are absent in sample #151669, CARTPT, HPCAL1, and VIM remain spatially localized within different regions of Layer 3, suggesting potential intralayer heterogeneity in this donor sample. Overall, geneCover identifies coherent layer-specific gene expression patterns that are conserved across all three donors, underscoring its ability to detect shared transcriptional signatures.
To further assess the robustness gained by enforcing cross-condition coverage, we applied geneCover to the IFNB data set, which comprises two experimental conditions that introduce a large systematic shift in transcriptomic profiles (Supplemental Fig. S13). We compared “condition-aware markers”—selected by the generalized geneCover (condition-aware markers remain “label-free,” by which we mean they have no access to biological or phenotypic labels such as cell type annotations throughout the paper but do incorporate known technical conditions such as batch or treatment)—to “condition-unaware markers” obtained by running the vanilla geneCover on the pooled data.
First, condition-aware markers yielded consistently lower AUC-ROC scores (see Supplemental Methods) when used to predict condition labels (Supplemental Fig. S14A), indicating that they are less driven by condition-specific signals and therefore more robust across conditions. Next, we performed Leiden clustering on the combined data set (without data integration), restricting the data set to the selected marker genes. Clusters derived from condition-aware markers more faithfully recovered annotated cell types (Supplemental Fig. S14B) and showed less bias toward either condition. For example, CD4 memory and CD4 naive T cells formed two distinct, condition-conserved clusters when using condition-aware markers (Supplemental Fig. S14C, cluster 0 and cluster 1), whereas the condition-unaware markers failed to separate these subtypes and instead produced clusters dominated by condition-driven variation (Supplemental Fig. S14D, cluster 0 and cluster 1). We observed the same trend for B cells and pDCs. To conclude, these results demonstrate that the generalized (condition-aware) geneCover markers more effectively suppress technical variation while preserving biologically meaningful, cross-condition signals.
Discussion
In this work, we propose geneCover as a novel label-free marker gene selection algorithm for single-cell and spatial transcriptomics. geneCover employs a minimal-weight set covering approach to identify a minimally redundant panel of marker genes that represent distinct correlation structures within the transcriptome. Our study demonstrates that geneCover provides a robust and scalable solution for label-free marker gene selection, outperforming existing label-free methods in both computational efficiency and accuracy in resolving refined spatial organization or rare cell types in spatial transcriptomics and scRNA-seq data.
geneCover excels at identifying a minimally redundant marker panel that captures various sources of meaningful transcriptional variability. By leveraging minimal set covering to explore distinct gene-gene correlation groups, geneCover facilitates the discovery of granular biological signals as effectively as it identifies marker genes with large variations across cell types. This allows geneCover to significantly enhance the resolution of scRNA-seq and spatial transcriptomics discovery. Notably, geneCover markers enable the division of the highly refined CA1–CA3 subiculum in the mouse brain hippocampus into two distinct regions—a distinction that other existing strategies fail to achieve. In addition, using geneCover markers, we identify a transcriptionally distinct immune cell subpopulation characterized by dendritic cell markers, suggesting the potential to uncover previously unrecognized cell types or subpopulations. The ability to identify finely organized and transcriptionally distinct cell subpopulations is crucial for advancing our understanding of tissue heterogeneity, disease progression, and cellular dynamics.
However, we note that the conventional clustering pipeline we use introduces certain limitations that may impact the identification of rare cell states. In all of our analyses, we apply Leiden clustering either on the PCA-transformed marker gene expression data or directly on the marker gene expression matrix. This approach has two main constraints. First, principal components primarily capture dominant cell type signals from populations characterized by many highly expressed, variable marker genes, which may result in the loss of signals defining rare cell states. Second, even when PCA is omitted, graph-based clustering methods typically construct the cell-cell graph using Euclidean distance on expression vectors. This metric can be insensitive to highly specific marker genes that distinguish subtle cell populations, potentially affecting their detection. Despite these challenges, geneCover markers still enhance resolution in identifying rare cell populations. This reflects the ability of our iterative covering framework to identify an adequate number of rare cell type signals that remain recognizable by conventional clustering pipelines. Future work could address these limitations by incorporating dimensionality reduction techniques that better capture local signals characterizing subtle cell populations (DeMeo and Berger 2023), alongside specialized rare cell discovery methods (Wen and Tang 2015; Jindal et al. 2018; Wegmann et al. 2019; Dong and Yuan 2020).
Beyond its improved resolution, geneCover achieves significantly faster empirical run times compared to other label-free marker gene selection methods, particularly on large omics data sets. As cellular resolution continues to expand in whole-transcriptome spatial transcriptomics, the ability to process larger and more complex data sets efficiently will be critical. geneCover offers a highly practical solution for modern high-throughput analyses and is well-positioned to adapt to these growing data modalities.
Furthermore, our analysis demonstrates that geneCover is fairly robust to hyperparameter selection. We show that adjusting the gene neighborhood size threshold m and the sequence of incremental sizes {kt}1:T allows for fine-tuning marker gene selection while preserving signals necessary to identify spatially refined structures. One of the key findings is the self-adjusting property of geneCover: for a fixed marker panel size, increasing m lowers the final correlation threshold λ, ensuring that marker genes remain effective in capturing fine-grained spatial structures even under stricter coverage constraints. However, lowering kt excessively without compensatory adjustments can lead to a loss of resolution due to an increase in λ, which results in a bias toward selecting genes that capture broad variability rather than region-specific signals. To capture additional signals defining rare cell identities, the number of iterations T can be increased, allowing the panel to expand beyond the previously fixed size.
Based on these observations, we provide the following general recommendations for selecting geneCover's hyperparameters. For m, we suggest starting with a moderate value (e.g., m ≤ 6) to prevent overfiltering of signals even though geneCover is relatively robust to this parameter. For the incremental sizes {kt}1:T, we recommend using a balanced sequence with moderate values of kt, such as {100, 100, …}, to maintain consistency in marker selection while ensuring comprehensive coverage of λ. The general principle is to fine-tune hyperparameters so that the final correlation threshold λ effectively distinguishes biologically relevant correlated gene groups. Because geneCover provides functionality to monitor λ in the package, users can empirically determine suitable values based on their data set. Our proposed iterative approach also naturally supports this tuning process, as each iteration yields a different λ. This allows us to sequentially explore signals representing the diverse correlation structure of the transcriptome.
Lastly, we demonstrate that geneCover can be naturally extended to identify shared molecular signals across multiple tissue samples or conditions, ensuring consistent selection of marker genes that may facilitate the discovery of conserved biological structures. Applying this framework to three DLPFC donor samples, we show that jointly identified marker genes accurately reflect the cortical layer organization with highly localized expression patterns. These markers not only delineate Layers 1 through 6 and the white matter but also exhibit structured spatial transitions across cortical layers. Additionally, subtle intralayer heterogeneity observed in Layer 3 of donor sample #151669 highlights geneCover's ability to detect variation within conserved spatial structures. Moreover, when applied to the IFNB single-cell data set, where interferon beta stimulation induces a systematic shift in transcriptional profiles that can bias downstream analyses, our generalized geneCover framework is able to identify marker genes whose expressions are conserved across control and stimulated conditions. These conserved markers, in turn, help recover some clusters that align with annotated cell types shared between both conditions. Together, these findings suggest that by leveraging replicate gene–gene correlation structure, the generalized framework can improve the robustness of marker gene selection against condition-driven biases.
Software availability
The Python implementation of geneCover is publicly available at GitHub (https://github.com/ANWANGJHU/GeneCover). All custom scripts and unpublished code needed to reproduce our results are provided as Supplemental Code.
Competing interest statement
The authors declare no competing interests.
Acknowledgments
The work is supported by National Science Foundation Award 2124230 and National Institutes of Health grant P50 MH094268. We thank Jean Fan, Luigi Marchionni, and Caleb Hallinan for their valuable discussions on data set selection and computational experiment design. We also thank Hongyu Cheng for insightful discussions on integer programming.
Author contributions: A.W. performed the computational analyses and drafted the manuscript. S.H., D.G., and L.Y. supervised the project, provided conceptual guidance, and critically reviewed and edited the manuscript.
Notes
[2] Supplementary material [Supplemental material is available for this article.]
[3] Article published online before print. Article, supplemental material, and publication date are at https://www.genome.org/cgi/doi/10.1101/gr.280539.125.
References
- ↵10x Genomics. 2024. Visium HD Spatial Gene Expression Library, Mouse Brain FFPE. https://www.10xgenomics.com/datasets/visium-hd-cytassist-gene-expression-libraries-of-mouse-brain-he
- ↵Armingol E, Baghdassarian HM, Lewis NE. 2024. The diversification of methods for studying cell–cell interactions and communication. Nat Rev Genet 25: 381–400. 10.1038/s41576-023-00685-8
- ↵Balas E, Padberg MW. 1972. On the set-covering problem. Oper Res 20: 1152–1161. 10.1287/opre.20.6.1152
- ↵Covert I, Gala R, Wang T, Svoboda K, Sümbül U, Lee SI. 2023. Predictive and robust gene selection for spatial transcriptomics. Nat Commun 14: 2091. 10.1038/s41467-023-37392-1
- ↵DeMeo B, Berger B. 2023. SCA: recovering single-cell heterogeneity through information-based dimensionality reduction. Genome Biol 24: 195. 10.1186/s13059-023-02998-7
- ↵Dong R, Yuan GC. 2020. GiniClust3: a fast and memory-efficient tool for rare cell type identification. BMC Bioinformatics 21: 158. 10.1186/s12859-020-3482-1
- ↵Dumitrascu B, Villar S, Mixon DG, Engelhardt BE. 2021. Optimal marker gene selection for cell type discrimination in single cell analyses. Nat Commun 12: 1186. 10.1038/s41467-021-21453-4
- ↵duVerle DA, Yotsukura S, Nomura S, Aburatani H, Tsuda K. 2016. CellTree: an R/bioconductor package to infer the hierarchical structure of cell populations from single-cell RNA-seq data. BMC Bioinformatics 17: 363. 10.1186/s12859-016-1175-6
- ↵Grønbech CH, Vording MF, Timshel PN, Sønderby CK, Pers TH, Winther O. 2020. scVAE: variational auto-encoders for single-cell gene expression data. Bioinformatics 36: 4415–4422. 10.1093/bioinformatics/btaa293
- ↵Hao Y, Hao S, Andersen-Nissen E, Mauck WM, Zheng S, Butler A, Lee MJ, Wilk AJ, Darby C, Zager M, 2021. Integrated analysis of multimodal single-cell data. Cell 184: 3573–3587.e29. 10.1016/j.cell.2021.04.048
- ↵Heger L, Balk S, Lühr JJ, Heidkamp GF, Lehmann CH, Hatscher L, Purbojo A, Hartmann A, Garcia-Martin F, Nishimura SI, 2018. CLEC10A is a specific marker for human CD1c+ dendritic cells and enhances their toll-like receptor 7/8-induced cytokine secretion. Front Immunol 9: 744. 10.3389/fimmu.2018.00744
- ↵Janesick A, Shelansky R, Gottscho AD, Wagner F, Williams SR, Rouault M, Beliakoff G, Morrison CA, Oliveira MF, Sicherman JT, 2023. High resolution mapping of the tumor microenvironment using integrated single-cell, spatial and in situ analysis. Nat Commun 14: 8353. 10.1038/s41467-023-43458-x
- ↵Ji L, Wang A, Sonthalia S, Seo S, Naiman DQ, Younes L, Colantuoni C, Geman D. 2025. CellCover defines marker gene panels capturing developmental progression in neocortical neural stem cell identity. eLife 14: RP107531. 10.7554/eLife.107531.1
- ↵Jindal A, Gupta P, Jayadeva, Sengupta D. 2018. Discovery of rare cells from voluminous single cell expression data. Nat Commun 9: 4719. 10.1038/s41467-018-07234-6
- ↵Kang HM, Subramaniam M, Targ S, Nguyen M, Maliskova L, McCarthy E, Wan E, Wong S, Byrnes L, Lanata CM, 2018. Multiplexed droplet single-cell RNA-sequencing using natural genetic variation. Nat Biotechnol 36: 89–94. 10.1038/nbt.4042
- ↵Liang S, Mohanty V, Dou J, Miao Q, Huang Y, Müftüoğlu M, Ding L, Peng W, Chen K. 2021. Single-cell manifold-preserving feature selection for detecting rare cell populations. Nat Comput Sci 1: 374–384. 10.1038/s43588-021-00070-7
- ↵Lopez R, Regier J, Cole MB, Jordan MI, Yosef N. 2018. Deep generative modeling for single-cell transcriptomics. Nat Methods 15: 1053–1058. 10.1038/s41592-018-0229-2
- ↵Maynard KR, Collado-Torres L, Weber LM, Uytingco C, Barry BK, Williams SR, Catallini JL, Tran MN, Besich Z, Tippani M, 2021. Transcriptome-scale spatial gene expression in the human dorsolateral prefrontal cortex. Nat Neurosci 24: 425–436. 10.1038/s41593-020-00787-0
- ↵Missarova A, Jain J, Butler A, Ghazanfar S, Stuart T, Brusko M, Wasserfall C, Nick H, Brusko T, Atkinson M, 2021. geneBasis: an iterative approach for unsupervised selection of targeted gene panels from scRNA-seq. Genome Biol 22: 333. 10.1186/s13059-021-02548-z
- ↵Prussin C, Griffith DT, Boesel KM, Lin H, Foster B, Casale TB. 2003. Omalizumab treatment downregulates dendritic cell FcεRI expression. J Allergy Clin Immunol 112: 1147–1154. 10.1016/j.jaci.2003.10.003
- ↵Ranjan B, Sun W, Park J, Mishra K, Schmidt F, Xie R, Alipour F, Singhal V, Joanito I, Honardoost MA, 2021. DUBStepR is a scalable correlation-based feature selection method for accurately clustering single-cell data. Nat Commun 12: 5849. 10.1038/s41467-021-26085-2
- ↵Stoeckius M, Hafemeister C, Stephenson W, Houck-Loomis B, Chattopadhyay PK, Swerdlow H, Satija R, Smibert P. 2017. Simultaneous epitope and transcriptome measurement in single cells. Nat Methods 14: 865–868. 10.1038/nmeth.4380
- ↵Sun Z, Wang T, Deng K, Wang XF, Lafyatis R, Ding Y, Hu M, Chen W. 2018. DIMM-SC: a Dirichlet mixture model for clustering droplet-based single cell transcriptomic data. Bioinformatics 34: 139–146. 10.1093/bioinformatics/btx490
- ↵Traag VA, Waltman L, van Eck NJ. 2019. From Louvain to Leiden: guaranteeing well-connected communities. Sci Rep 9: 5233. 10.1038/s41598-019-41695-z
- ↵Vargo AHS, Gilbert AC. 2020. A rank-based marker selection method for high throughput scRNA-seq data. BMC Bioinformatics 21: 477. 10.1186/s12859-020-03641-z
- ↵Wegmann R, Neri M, Schuierer S, Bilican B, Hartkopf H, Nigsch F, Mapa F, Waldt A, Cuttat R, Salick MR, 2019. CellSIUS provides sensitive and specific detection of rare cell populations from complex single-cell RNA-seq data. Genome Biol 20: 142. 10.1186/s13059-019-1739-7
- ↵Wen L, Tang F. 2015. How to catch rare cell types. Nature 525: 197–198. 10.1038/nature15204
- ↵Wolf FA, Angerer P, Theis FJ. 2018. SCANPY: large-scale single-cell gene expression data analysis. Genome Biol 19: 15. 10.1186/s13059-017-1382-0