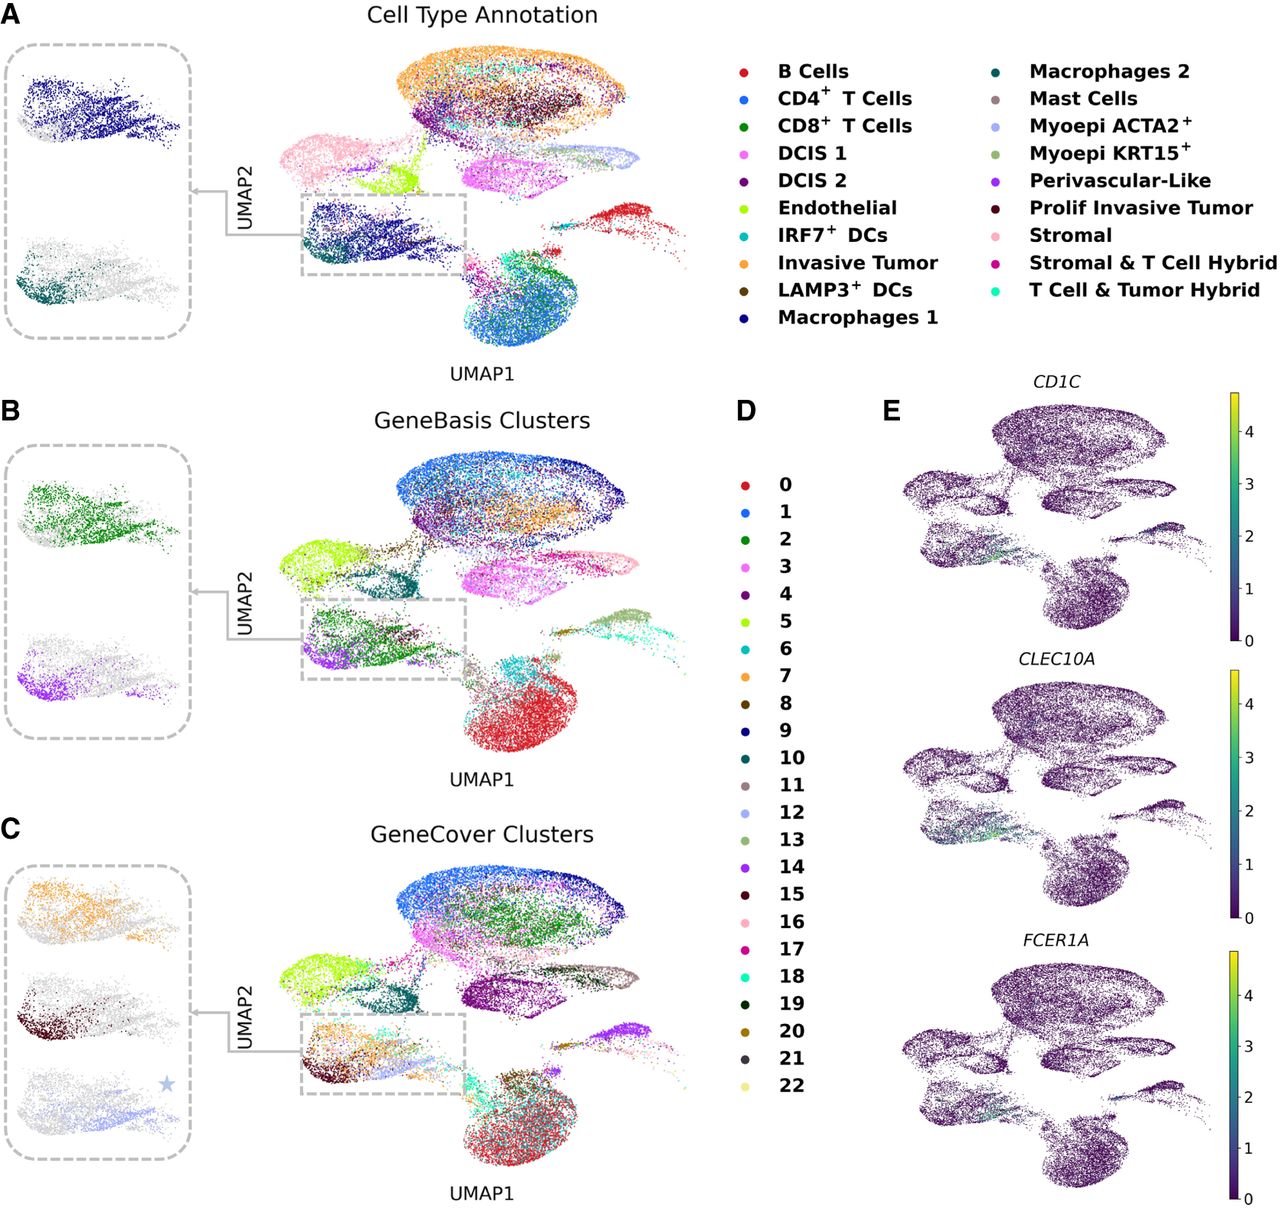
Figure 4.
geneCover markers facilitate the identification of a transcriptionally distinct immune cell subpopulation in breast cancer. To obtain the geneCover marker panel, we apply Iterative-GeneCover in Algorithm 1 with parameters: {kt}1:T = {100, 100, 100}, m = 3. (A) UMAP visualization of cell type annotations provided by the data set, with a zoom-in on the Macrophage 1 and Macrophage 2 subpopulations. (B) Data-driven Leiden clusters learned from 300 geneBasis markers using the standard pipeline. (C) Same as panel B, but for 300 geneCover markers. (D) Legend for the clusters in panels B and C. (E) Differentially expressed genes for geneCover Cluster 12.