Abstract
RNA modifications play critical roles in cellular homeostasis and development by regulating gene expression, RNA metabolism, and translation. Their dysregulation contributes to the development of human diseases, including cancer. 3-methylcytidine (m3C) primarily occurs in transfer RNA, where it regulates translation, stem cell pluripotency, and mitochondrial function. m3C has also been detected in polyadenylated (poly[A]) RNA by mass spectrometric analysis; however, its transcriptome-wide distribution and functions remain unknown because of its low abundance and technical challenges. Here, we show that METTL2A, an m3C writer, is upregulated and associated with poor prognosis in pancreatic cancer tumors, while also being essential for pancreatic cancer cell proliferation. Using comparative nanopore direct RNA sequencing, we identify potential METTL2A-mediated m3C sites in poly(A) RNA. These m3C sites are mapped in both messenger RNA and mitochondrial RNA and are enriched in the CC motif and coding sequences. METTL2A knockdown alters expression of S100A4 mRNA isoforms, which contains METTL2A-mediated m3C sites. Notably, many transcripts with METTL2A-mediated m3C sites are upregulated upon METTL2A knockdown. We reveal the transcriptome-wide presence of m3C sites in poly(A) RNA and suggest their potential roles in regulating gene expression.
All key biological macromolecules, including DNA, RNA, proteins, and lipids, undergo covalent modifications that influence their structure, function, and stability. Covalent modifications of RNA, whose regulatory mechanism is known as epitranscriptomics, affect gene expression regulation, RNA metabolism, and translation into proteins (Roundtree et al. 2017; Wiener and Schwartz 2021). More than 300 distinct chemical modifications on RNA have been identified to date (Cappannini et al. 2024). Their functions are mediated by the addition of modifications by writers, the removal of modifications by erasers, and the recognition of modified RNA by readers (Shi et al. 2019; Anreiter et al. 2021). RNA modifications play critical roles in cell homeostasis and development (Roundtree et al. 2017; Frye et al. 2018), and dysregulation of these modifications contributes to the pathogenesis of human diseases, including cancer (Barbieri and Kouzarides 2020).
To gain a better understanding of the functional roles of RNA modifications, it is necessary to accurately determine modification locations and levels in biological samples. Whereas techniques such as liquid chromatography-mass spectrometry (LC-MS/MS) are commonly used to detect and quantify modification levels with high specificity and sensitivity, high-resolution mapping of modified sites is essential for uncovering the mechanisms behind these modifications and their biological significance (Moshitch-Moshkovitz et al. 2022; Kong et al. 2023). Many sequencing-based approaches, using short- or long-read sequencing platforms, map RNA modifications across the transcriptome, revealing their patterns in normal and disease states across various cell types, tissues, organisms, and under different environmental conditions and stimuli (Moshitch-Moshkovitz et al. 2022). Short-read sequencing-based approaches require pretreatment or labeling of transcripts with reverse transcriptase signatures, antibodies, chemicals, or enzymes prior to sequencing for the differentiation of modified and unmodified bases. In contrast, long-read sequencing-based methods, using single-molecule real-time (SMRT) or nanopore sequencing technology, can directly detect modified bases, eliminating the need for such preprocessing (Moshitch-Moshkovitz et al. 2022; Kong et al. 2023). The SMRT sequencing platform has been adapted for direct RNA sequencing by replacing the standard DNA polymerase with a reverse transcriptase (Vilfan et al. 2013), although this approach has not been widely adopted. Nanopore direct RNA sequencing has made it possible to directly sequence full-length native RNA molecules without reverse transcription and amplification, preserving the modification information at the single-read level (Garalde et al. 2018; Workman et al. 2019). As an RNA molecule passes through a nanopore, it generates a distinctive and typical shift in ion currents. Approximately five nucleotides, known as a k-mer, are present within the pore at any given moment, resulting in k-mer-specific ion current shifts. RNA modifications can cause further shifts in the ion currents. Methods for detecting these alterations can be divided into two categories: de novo prediction, and comparative approaches. De novo prediction methods, including Tombo (Stoiber et al. 2016), nanoDoc (Ueda 2021), CHEUI (Acera Mateos et al. 2024), and TandemMod (Wu et al. 2024), use a trained model to predict RNA modifications, whereas comparative methods, such as ELIGOS (Jenjaroenpun et al. 2021) and Nanocompore (Leger et al. 2021; Mulroney et al. 2023), rely on the comparison of two samples to detect RNA modifications. Although de novo prediction methods allow for detailed analyses, including the identification of multiple RNA modifications within the same sample (Acera Mateos et al. 2024; Wu et al. 2024), they require models trained on read signals from in vitro transcripts labeled with specific modifications. The development of models that account for a variety of modifications requires large training data sets. In contrast, comparative methods do not require training to detect individual modifications.
Recent studies suggest that 3-methylcytidine (m3C), typically located at position 32 on the anticodon loop of some transfer RNAs (tRNAs) (Bohnsack et al. 2022), may play a role in human biology and diseases. Four m3C writers have been identified in humans: METTL2A, METTL2B, METTL6, and METTL8 (Towns and Begley 2012). These enzymes methylate different tRNA types: METTL2A and METTL2B target tRNAsArg/Thr (Xu et al. 2017; Lentini et al. 2020), METTL6 methylates tRNASer (Xu et al. 2017; Ignatova et al. 2020; Mao et al. 2021), and METTL8 modifies mitochondrial tRNAsThr/Ser (Schöller et al. 2021; Kleiber et al. 2022; Lentini et al. 2022). Despite the similarity between METTL2A and METTL2B, METTL2B shows significantly lower methylation activity in vitro (Mao et al. 2021). These m3C writers and their cofactors have been linked to human diseases. For example, METTL6 is required for cell growth in hepatocellular carcinoma (Ignatova et al. 2020), whereas METTL8 levels correlate with patient survival and respiratory chain activity in pancreatic cancer (Schöller et al. 2021). A mutation in DALRD3, a cofactor of METTL2A and METTL2B, impairs m3C formation in patients with epileptic encephalopathy (Lentini et al. 2020).
LC-MS/MS analysis has detected m3C in polyadenylated (poly[A])-enriched RNA at levels ∼1000-fold lower than in tRNA (Xu et al. 2017), and similar studies have detected m3C in mRNA fractions obtained through poly(A) purification (Ma et al. 2019). To understand the function of m3C in poly(A) RNA, it is crucial to map m3C sites across the transcriptome. However, the mapping of m3C sites using immunoprecipitation (IP)-based sequencing approaches has not been reported because of the lack of commercially available anti-m3C antibodies suitable for IP (Bohnsack et al. 2022). Instead, two sequencing methods based on m3C-specific chemical cleavage, Hydrazine-Aniline Cleavage sequencing (HAC-seq) (Cui et al. 2021, 2024; Zhang et al. 2023) and AlkAniline sequencing (AlkAniline-Seq) (Marchand et al. 2018; Schöller et al. 2021), have been used to map m3C sites. A recent study using HAC-seq revealed METTL2A/2B/6-dependent methylomes in tRNA (Cui et al. 2024). In addition to known m3C sites, AlkAniline-Seq and HAC-seq have identified previously unknown m3C sites in tRNA (Cui et al. 2021; Schöller et al. 2021), showing that these sites are present not only in the anticodon loop but also in other loop structures and are located within the GGNCU motif (Marchand et al. 2018; Cui et al. 2021; Bohnsack et al. 2022). However, despite this success in mapping m3C in tRNA, no m3C sites were identified in non-tRNA species, such as messenger RNA (mRNA), likely because of the lower m3C levels in poly(A) RNA (Grozhik and Jaffrey 2018; Marchand et al. 2018; Cui et al. 2021; Bohnsack et al. 2022). Consequently, the distribution and function of m3C in poly(A) RNA remain largely unknown.
In this study, we aim to identify METTL2A-mediated m3C sites in poly(A) RNA using nanopore-based comparative direct RNA sequencing to characterize their distribution and function.
Results
METTL2A is required for the proliferation of pancreatic cancer cells
To explore the importance of m3C writers in cancer, we performed an integrative analysis of m3C writer mRNA expression using the TCGA (Weinstein et al. 2013) and GTEx (Aguet et al. 2017) data sets. All m3C writers were upregulated in 16 cancer types, including uterine, ovarian, and pancreatic cancer (Fig. 1A; Supplemental Table S1A). Because dysregulated expression does not always imply involvement in cancer development, we analyzed the correlation between m3C writer expression and patient survival using the TCGA data set. Several m3C writers, including METTL2A in pancreatic cancer, showed a significant correlation between expression levels and patient survival (Fig. 1B; Supplemental Table S1B). Pancreatic cancer, a highly aggressive and lethal cancer with a five-year survival rate of ∼10% (Siegel et al. 2022), showed upregulated METTL2A expression in tumors compared with normal tissues (Fig. 1C), and high METTL2A levels were associated with poor prognosis (Fig. 1D). We therefore decided to focus our analysis on METTL2A in pancreatic cancer.
METTL2A is required for the proliferation of pancreatic cancer cells. (A) Heat map displaying the relative expression levels of m3C writers across various cancer types in comparison with their normal tissues. Cancer types are arranged based on their relative expression in cancer versus normal tissue. (B) The association between m3C writer expression and patient prognosis across various cancer types. Cancer types associated with a favorable prognosis in the high-expression group (hazard ratio < 0 and P-value < 0.05 in the Cox proportional hazards model) are highlighted in red, whereas those associated with a poor prognosis in the high-expression group (hazard ratio > 0 and P-value < 0.05) are highlighted in blue. (C) Violin plots depicting the expression levels of m3C writers in pancreatic cancerous and normal tissues. (T) Tumor tissues, (N) normal tissues. (D) Kaplan–Meier plots showing the correlation between m3C writer expression and patient survival in pancreatic cancer. The red line represents patients with high m3C writer expression, and the blue line represents those with low expression; n (high) = 91, n (low) = 92. (E) The viability of AsPC-1, PANC-1, and SUIT-2 cells transfected with siRNAs targeting METTL2A, assessed by CellTiter-Glo assays. Results are expressed as the mean ± standard deviation (s.d.). (n = 4), (****) P < 0.0001.
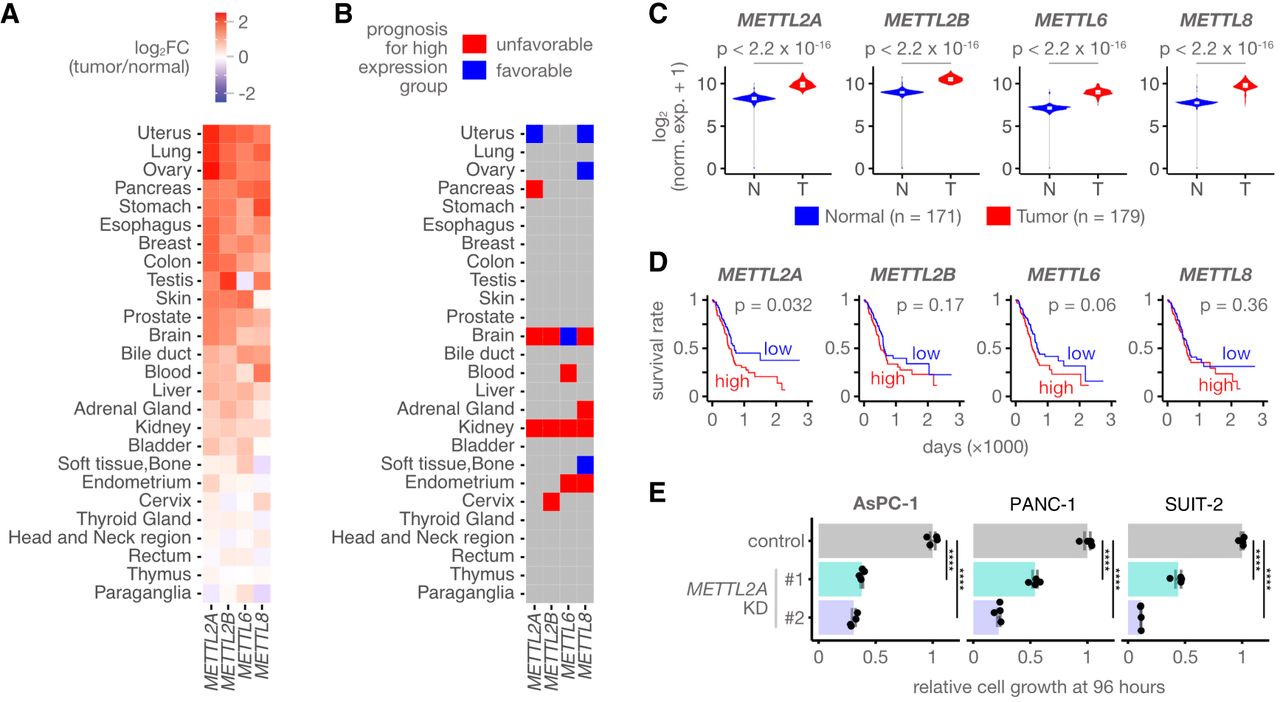
To clarify the significance of METTL2A in pancreatic cancer cell proliferation, we knocked down METTL2A using siRNAs targeting METTL2A, which led to reduced proliferation in three pancreatic cancer cell lines (Fig. 1E). In contrast, knockdown of METTL2B, METTL6, or METTL8 did not affect proliferation in AsPC-1 cells, a pancreatic cancer cell line (Supplemental Fig. S1A,B). These results suggest that METTL2A upregulation contributes to pancreatic cancer pathology by promoting cell proliferation.
METTL2A-mediated m3C sites are enriched in the CC motif of poly(A) RNA
To investigate the distribution of m3C in poly(A) RNA, we performed comparative direct RNA sequencing on the pancreatic cancer cell line AsPC-1 under METTL2A-knockdown and control conditions (Fig. 2A). We identified sites where METTL2A knockdown altered the distribution of the current intensity or dwell time using the Nanocompore framework (Fig. 2A; Leger et al. 2021; Mulroney et al. 2023). METTL2A knockdown resulted in changes in parameter distributions at 644 sites, with more than 90% (605 sites) showing only an increase in current intensity, representing 0.01% of all sites tested (Fig. 2B; Supplemental Fig. S2A,B). To determine whether these changes were due to a shift from m3C to C, we examined the base composition at altered sites. The C base was enriched at sites with increased current intensity but not at the sites with other parameter variations (Fig. 2C; Supplemental Fig. S2C,D). Moreover, 73% of the sites with increased current intensity had the CC motif in the middle (Supplemental Fig. S2D). In addition, transcripts with increased current intensity had a higher C or CC content compared with other transcripts (Supplemental Fig. S2E,F). In contrast, no distinctive sequence motifs were identified outside the k-mer sequence (Supplemental Fig. S2G). Although the shift in current intensity was small (Supplemental Fig. S2H), similar to observations of other RNA modifications (Garalde et al. 2018; Anreiter et al. 2021), it was reproducible across replicates (Supplemental Fig. S2I). To quantitatively assess the reliability of our detection, we estimated the false positive rate of our approach. Using the presence of a C base at the central position as a validation criterion, we found that 80% of the detected sites had a central C. Assuming that the number of false positives at sites with a C base in the middle is approximately the same as at sites with other bases in the middle (e.g., 6.7% = [100% − 80%]/3), we estimated the false positive rate to be ∼8.4% (=6.7%/80% × 100%). To further validate the robustness of our detection method, we performed additional quantitative analyses examining C-base enrichment under different P-value cutoffs. Whereas the number of detected sites varied across different cutoffs, C-base enrichment was consistently observed at all thresholds, with the proportion of C bases at the central position remaining consistent at approximately 80%, with non-C sites accounting for ∼20% (Supplemental Fig. S2J). Furthermore, the CC motif was consistently detected among the identified sites across all P-value cutoffs examined (Supplemental Fig. S2K,L). To detect other significant motifs beyond the CC motif, we performed MEME motif analysis, which revealed no other statistically significant motifs (Supplemental Fig. S2M). Taken together, these results suggest that most sites with increased current intensity are METTL2A-mediated m3C sites, specifically within the CC motif in poly(A) RNA.
METTL2A-mediated m3C sites are enriched in the CC motif of poly(A) RNA. (A) Schematic overview of the comparative direct RNA sequencing used to map m3C sites in poly(A) RNA. (B) Number of sites where signal alterations were detected for each parameter or method. (C) Logo plot of k-mer sequences with increased current intensity on METTL2A knockdown. (D) Flowchart illustrating the determination of m3C sites. (E) Relative distribution of m3C RNAs across different RNA classes. (F) Relative distribution of m3C sites across different RNA classes. (G) Percentage of m3C RNAs per chromosome. (H) Top 10 biological processes associated with the m3C RNAs, with mitochondrial-related processes highlighted in red.
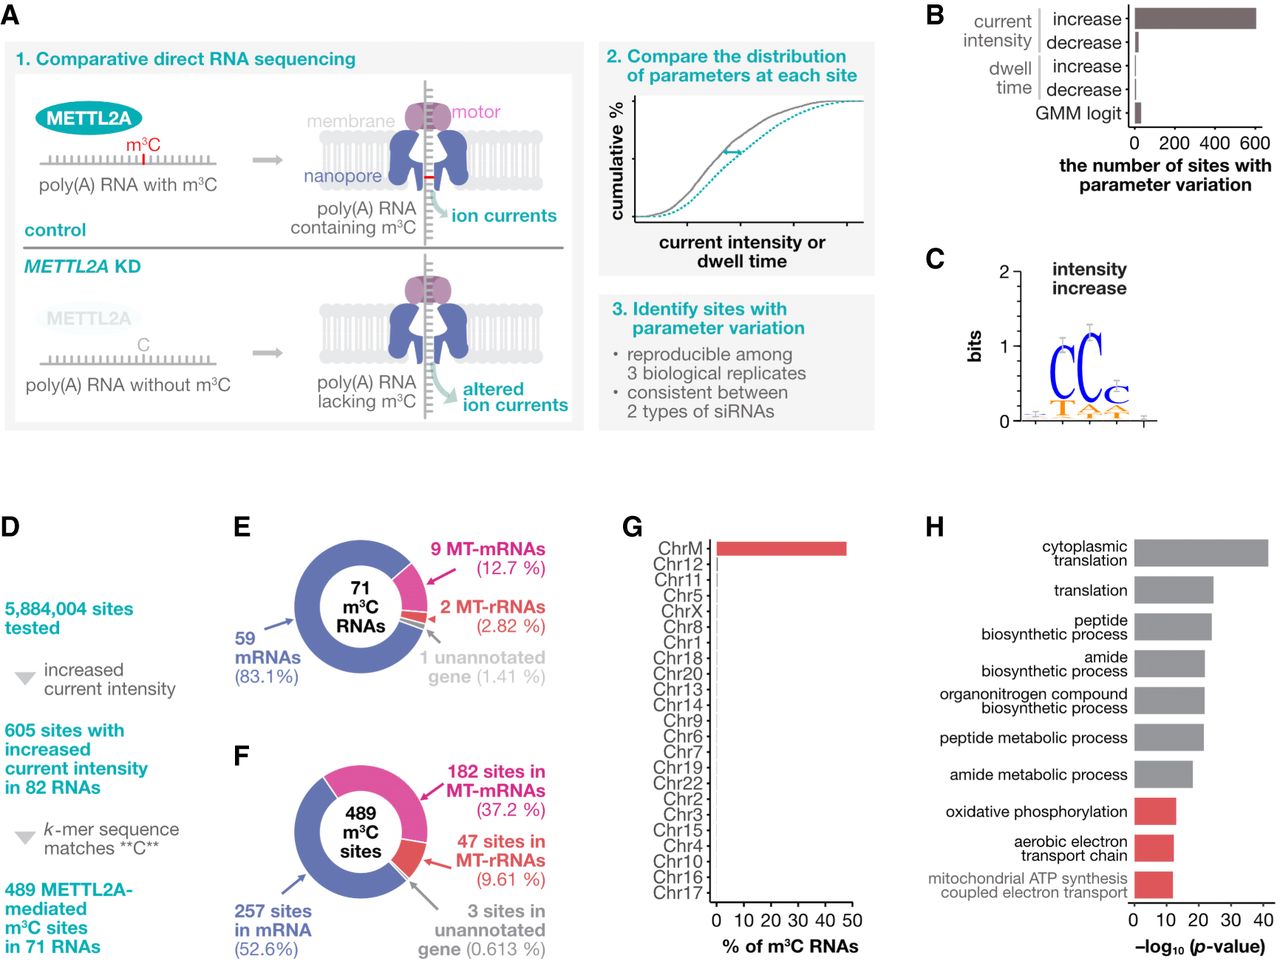
We next characterized the METTL2A-mediated m3C sites. Of the 605 sites with increased current intensity, 489 with a C base in the middle were identified as METTL2A-mediated m3C sites (Fig. 2D). These sites were found in 71 RNAs (m3C RNAs), predominantly mitochondrial rRNAs (MT-rRNAs), mitochondrial mRNAs (MT-mRNAs), and nuclear-encoded mRNAs (Fig. 2E,F). About half of the m3C sites were present in nuclear-encoded mRNAs, whereas the other half were in MT-mRNAs and MT-rRNAs, with a high enrichment in the mitochondrial genome (Fig. 2F,G). Nanopolish poly(A) analysis confirmed that the detected MT-mRNAs and MT-rRNAs possess poly(A) tails (Supplemental Fig. S3A). Immunostaining showed that, although METTL2A was mainly localized in the cytoplasm, a portion of METTL2A overlapped with mitochondria (Supplemental Fig. S4A–D). Enrichment analysis showed that these m3C RNAs were involved in translation processes and mitochondrial functions (Fig. 2H). Further analysis showed that m3C RNAs were shorter, more highly expressed, and had a higher C and CC content (Supplemental Fig. S5A). The detection of m3C sites appeared to be limited to well-expressed transcripts, requiring at least 100 mapped reads (Supplemental Fig. S5B). Of 401 RNAs meeting this threshold, only 20% were identified as m3C RNAs (Supplemental Fig. S5C). Of the 397,223 sites in these RNAs, 0.15% (605 sites) showed increased current intensity after METTL2A knockdown, with over 80% containing a C base in the middle (Supplemental Figs. S2D, S5D). These results suggest that, although METTL2A-mediated m3C sites are more likely to be detected in highly expressed RNAs, not all highly expressed RNAs have METTL2A-mediated m3C modifications.
To provide independent validation of our findings, we analyzed an existing AlkAniline-Seq data set (Schöller et al. 2021), which selectively sequences m3C-modified RNAs as well as RNAs modified with m7G and dihydrouridine. Among 4566 candidate cleavage sites with sufficient coverage, 790 C-base sites were identified as potential m3C sites, with the highest read counts observed at tRNAs, including MT-tRNAs (Supplemental Fig. S6A). Of these, 202 sites were located in MT-rRNA and 23 in mRNA, and notably, 10 of these overlapped with the METTL2A-mediated m3C sites identified in our study (Supplemental Fig. S6B).
To provide more detailed information on the modification rates of each m3C site, we used a Gaussian mixture model, as implemented in xPore (Pratanwanich et al. 2021). We assumed that (1) the distribution of current intensity at each m3C site is a mixture of two normal distributions—one corresponding to modified RNA and the other to unmodified RNA; and (2) these distributions do not vary between samples. After identifying the two distributions that best fit the current intensity data at each site using all samples, we calculated the proportion of modified RNA in each sample by fitting these distributions to the data from each sample (Supplemental Fig. S7A). In this stoichiometry analysis, we observed a decrease in modification at many m3C sites following METTL2A knockdown. Specifically, out of 489 sites analyzed, 97% (472 sites) showed a reduction in modification rate, and among these, 85% (414 sites) exhibited a statistically significant decrease (Supplemental Fig. S7B). These results suggest that METTL2A knockdown induces an increase in current intensity at these m3C sites.
m3C sites are enriched in coding sequences
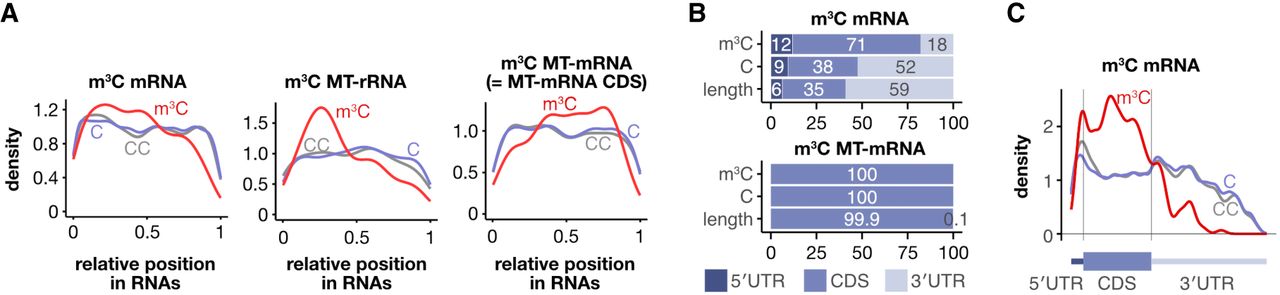
We analyzed the distribution of the m3C sites in poly(A) RNA. In MT-rRNA and mRNA, the distribution of m3C sites was relatively uniform, with a higher concentration toward the 5′ end (Fig. 3A). In contrast, in MT-mRNA, the m3C sites were depleted near both the 5′ and 3′ ends of the RNA (Fig. 3A), which correspond to the boundaries of the coding sequence (CDS), owing to the near absence of UTRs (Fig. 3B). Despite the different distribution patterns of the m3C sites, the CC motif was consistently enriched at the m3C sites across all RNA types (Supplemental Fig. S8A). We further analyzed the distribution of the m3C sites in MT-mRNA and mRNA. In m3C MT-mRNA, all cytosines were in the CDS, because of the lack of UTRs (Fig. 3B). In m3C mRNA, the m3C sites were enriched in the CDS and depleted in the 3′ UTR (Fig. 3B,C). Whereas 38% of the C bases were found in the CDS and 52% in the 3′ UTR, 71% of m3C sites were in the CDS and only 18% in the 3′ UTR (Fig. 3B). Within the UTRs, the m3C sites were enriched near the start or stop codon, with most located within 40 bases of the start codon or 200 bases from the stop codon, whereas they were relatively depleted near the start or stop codon in the CDS (Fig. 3C; Supplemental Fig. S8B). Despite these differences in distribution, the CC motif was consistently enriched at the m3C sites in each mRNA region (Supplemental Fig. S8C). These results indicate that m3C sites are enriched in the CDS and exhibit distinct distribution patterns depending on the type of poly(A) RNA.
m3C sites are enriched in coding sequences. (A) Distribution of the m3C sites across different RNA types. (B) Bar plots showing the percentage of m3C sites, C bases, and the length of each region in m3C mRNAs (upper) and MT-mRNAs (lower). (C) Distribution of m3C sites across different regions of the mRNAs.
Given that m3C is known to occur in the loop structures of tRNAs (Cui et al. 2021), we investigated whether m3C sites in poly(A) RNAs are also preferentially located within loop regions. To address this, we predicted the minimum free energy structure for each m3C-containing RNA and assessed the localization of m3C and other C sites within loops. The proportion of m3C and C sites present in loops was similar across different RNA types and transcript regions containing m3C sites (Supplemental Fig. S9A,B). Furthermore, the overall structuredness of m3C-containing RNAs was comparable to that of other RNAs (Supplemental Fig. S9C). These results indicate that, unlike in tRNAs, m3C sites in poly(A) RNAs are not specifically associated with loop structures.
METTL2A downregulates m3C RNAs
To investigate the role of METTL2A in pancreatic cancer cells, we analyzed METTL2A-regulated genes in AsPC-1 cells. Direct RNA sequencing revealed that METTL2A knockdown led to the down- and upregulation of 540 and 438 RNAs, respectively (Fig. 4A,B). Notably, m3C RNAs were highly enriched among the RNAs upregulated on METTL2A knockdown (Fig. 4C): Only one m3C RNA (S100A4-201, discussed later) was downregulated, whereas more than 40% (30 of 71) of the m3C RNAs were significantly upregulated following METTL2A knockdown (Fig. 4D). These upregulated m3C RNAs were enriched in mitochondrial-related genes (Supplemental Fig. S10A). These findings were further supported by the short-read RNA-seq results (Supplemental Fig. S10B–D). Furthermore, additional analyses demonstrated that the increase in current intensity at m3C sites upon METTL2A knockdown was not simply attributable to increased read coverage but instead reflected specific m3C modification events (Supplemental Fig. S10E). Taken together, these results suggest that METTL2A downregulates the METTL2A-mediated m3C RNAs.
METTL2A downregulates m3C RNAs. (A) Hexagonal two-dimensional heat map showing the correlation of expression changes between the two siRNAs in the direct RNA sequencing data. Statistical significance was determined by Spearman's correlation test. 2A KD: METTL2A knockdown. (B) Venn diagrams showing the number of transcripts upregulated or downregulated by each siRNA in the direct RNA sequencing data. (C) Stacked bar plots showing the percentage of m3C RNAs and other RNAs. (D) Venn diagrams showing the overlap between m3C RNAs and differentially expressed transcripts following METTL2A knockdown. (E) The top 10 biological processes enriched in the upregulated and downregulated transcripts, in red and blue, respectively.
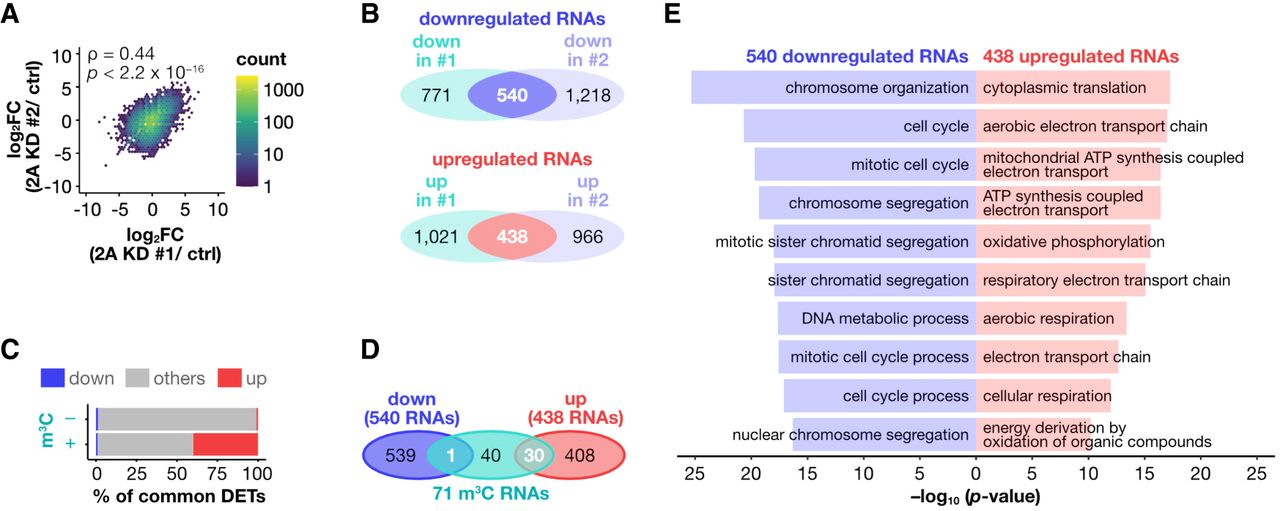
Next, we performed over-representation analysis to identify the biological processes associated with the differentially expressed transcripts upon METTL2A depletion. Both direct RNA sequencing and short-read RNA-seq revealed that the upregulated RNAs were associated with translation processes and mitochondrial function, consistent with the results observed for m3C sites, whereas the downregulated RNAs were associated with processes related to chromosome organization, cell cycle, and cell division (Fig. 4E; Supplemental Fig. S10F,G). The enrichment of processes related to the cell cycle and cell division suggests that METTL2A plays a critical role in regulating pancreatic cancer cell proliferation.
m3C sites near exon junctions influence S100A4 isoform expression
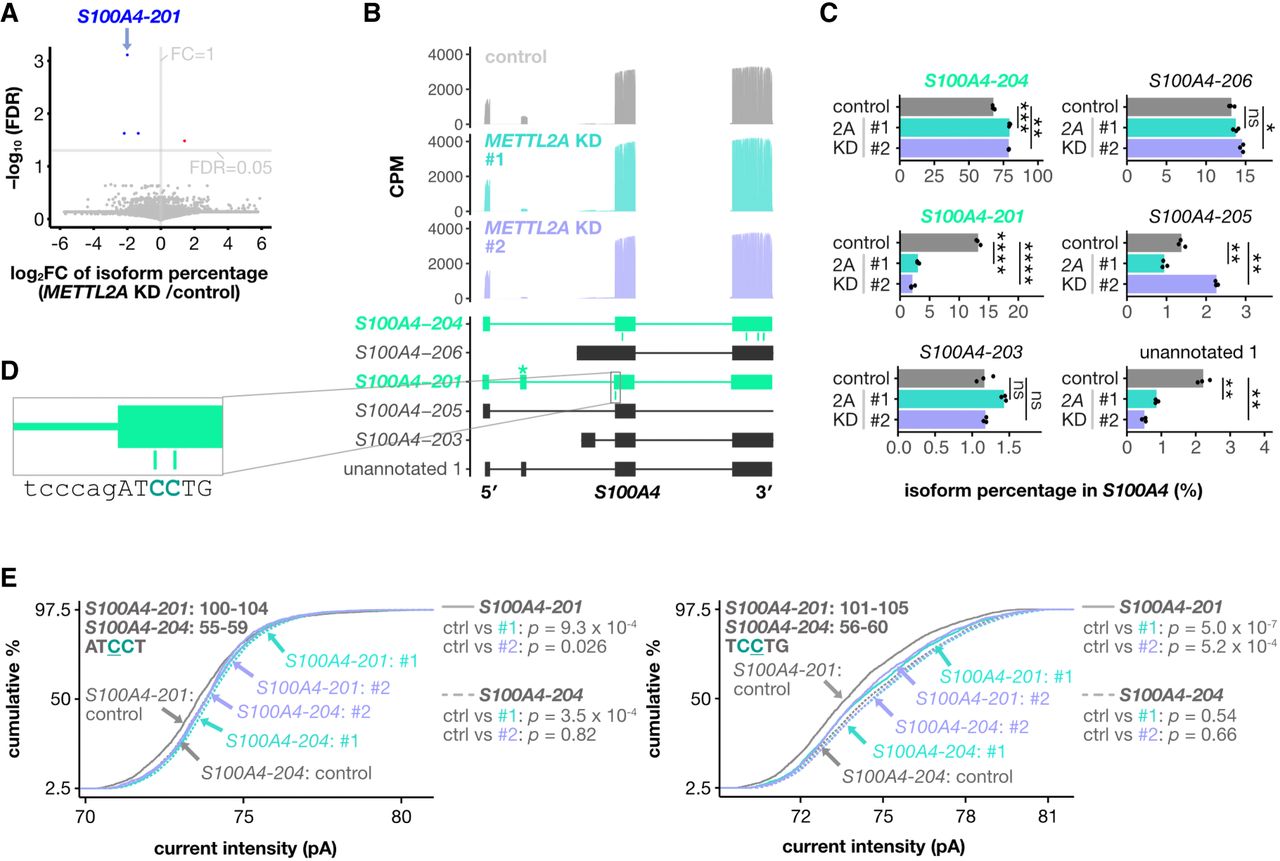
RNA modifications are known to influence isoform expression, as demonstrated by METTL3, an m6A writer, which affects RNA splicing patterns (Xiao et al. 2016; Price et al. 2020). We investigated whether METTL2A-mediated m3C modification affects isoform expression. Most RNA isoforms showed minimal changes in proportion after METTL2A knockdown (Fig. 5A). However, the isoform most impacted by METTL2A knockdown was S100A4-201, an m3C-modified RNA (Fig. 5A). In AsPC-1 cells, the major isoform of S100A4 was S100A4-204, which contained four m3C sites and lacked the second exon of S100A4-201 (Fig. 5B,C; Supplemental Fig. S11A,B). METTL2A knockdown increased the abundance of S100A4-204 and decreased S100A4-201 (Fig. 5C; Supplemental Fig. S11A,D). In addition, an unannotated isoform that partially shares the second exon of S100A4-201 was reduced following METTL2A knockdown (Fig. 5C; Supplemental Fig. S11A). Although six m3C sites were present in the exons of both S100A4-201 and S100A4-204, the two isoforms did not share any common m3C sites (Fig. 5B). The two S100A4-201-specific m3C sites were located near the exon junction on the 5′ side of the third exon, adjacent to the second exon that is absent in S100A4-204 (Fig. 5D). Significant differences in the current intensity at the S100A4-201-specific m3C sites were observed between S100A4-201 and S100A4-204 under control conditions but disappeared after METTL2A knockdown, suggesting that METTL2A specifically methylates these C sites in S100A4-201 (Fig. 5D,E). Taken together, these results suggest that METTL2A-mediated m3C sites near exon junctions may influence the expression balance of S100A4 isoforms.
m3C sites near exon junctions contribute to exon skipping in S100A4 mRNA. (A) Volcano plot showing the changes in isoform percentages across all RNAs on METTL2A knockdown. Isoforms with a significant increase are highlighted in red, and those with a significant decrease are shown in blue. (B) Mapping patterns of S100A4 isoforms in direct RNA sequencing under each condition. Methylated isoforms are highlighted in green, with m3C sites indicated in green below the mapping for each sample. The second exon of S100A4 is marked with an asterisk (*). (C) Bar plots showing the percentage of each S100A4 isoform expressed under each condition. (D) The surrounding sequence of the S100A4-201-specific m3C sites. Exon sequences are shown in uppercase and intron sequences in lowercase. (E) Cumulative percentage of current intensity at the corresponding positions of the two isoforms under each condition. P-values were calculated using Nanocompore. In B and C, only isoforms representing more than 1% of the reads for the gene are shown.
To further investigate the direct connection between m3C sites and isoform expression, we generated a mutant cell line in which the m3C sites near the S100A4 exon junction were mutated to other bases using CRISPR. Sanger sequencing confirmed that the two m3C sites were mutated to TT and TA in this clone (Supplemental Fig. S11C). In the mutant cell line, S100A4-201 expression was markedly decreased compared with that in the parental line, and METTL2A knockdown did not further decrease S100A4-201 expression (Supplemental Fig. S11D). These results suggest that methylation at these m3C sites contributes to the expression of S100A4-201.
To address the question of whether METTL2A-mediated effects on isoform expression occur through nuclear mechanisms, we examined the subcellular localization of METTL2A using immunostaining and subcellular fractionation. Our analysis revealed that FLAG-tagged METTL2A was primarily localized in the cytoplasm, but a portion of the protein also showed nuclear localization (Supplemental Fig. S4A–E), supporting the possibility that some METTL2A may be involved in nuclear RNA processing.
To determine whether the observed changes in S100A4 isoform expression contribute to the METTL2A knockdown phenotype, we performed additional functional analyses. Although the mutant cells exhibited altered S100A4 isoform expression, METTL2A knockdown still suppressed cell growth, similar to that in the parental cells (Supplemental Fig. S11E). To further assess the functional relevance of S100A4-201 downregulation in pancreatic cancer cell growth, we designed siRNAs targeting exon 2 of S100A4-201, which is specific to this isoform. These siRNAs reduced the expression of S100A4-201 without significantly affecting the expression of S100A4-204, the major S100A4 isoform (Supplemental Fig. S11F). However, no apparent effect on AsPC-1 cell growth was observed following transfection with these siRNAs (Supplemental Fig. S11G). These results suggest that the changes in S100A4 isoform usage are not directly responsible for the growth suppression observed upon METTL2A knockdown.
Discussion
In this study, we have demonstrated that METTL2A is required for the growth of pancreatic cancer cells. We also identified METTL2A-mediated m3C sites in poly(A) RNA using comparative direct RNA sequencing. These sites are mainly located in mRNA, MT-rRNA, and MT-mRNA involved in translation processes and mitochondrial functions, with the m3C being relatively uniformly distributed in poly(A) RNAs within the CC motif. Notably, METTL2A downregulates many of the m3C RNAs. Furthermore, m3C sites near exon junctions may be associated with changes in S100A4 isoform expression following METTL2A knockdown.
This study used nanopore direct RNA sequencing to identify the METTL2A-mediated m3C sites in poly(A) RNA by analyzing parameter shifts upon METTL2A knockdown. Most of the parameter variation induced by METTL2A knockdown was attributed to increased current intensity, and the enrichment of C bases at the sites with increased current intensity suggests that they are likely to be modified with m3C. Although the exact mechanism underlying the decreased current intensity at m3C sites compared to unmodified C sites remains unclear, one possible explanation is that the addition of a methyl group at the N3 position of cytidine increases the steric bulk of the base, which may alter the interaction between the RNA and the nanopore, resulting in reduced current. This is consistent with previous reports showing that m6A methylation also leads to decreased current intensity compared to unmodified adenosine (Pratanwanich et al. 2021). However, the small shifts in current intensity limited the detection of m3C sites to highly expressed RNAs. Moreover, the subtle changes in current intensity make it difficult to determine which reads contain the m3C modification. The development of methods that can directly detect m3C would enhance the detection sensitivity and allow more detailed studies. In addition, our approach, which only requires siRNA targeting the modification writer and a nanopore sequencing device, is straightforward to implement. Although the m3C sites identified here are specific to METTL2A-mediated m3C sites, applying this method to the other m3C writers could identify their respective m3C sites. Furthermore, our approach may be applicable to other RNA modifications by analyzing the corresponding parameter variations.
A key strength of this study is the identification of potential m3C sites in poly(A) RNA. Whereas previous mass spectrometry studies have confirmed the presence of m3C in poly(A) RNA (Xu et al. 2017; Ma et al. 2019), subsequent studies using HAC-seq and AlkAniline-Seq failed to detect m3C sites in RNAs other than tRNA (Marchand et al. 2018; Cui et al. 2021). These failures can be attributed to several factors. First, the m3C levels in poly(A) RNA are ∼1000-times lower than those in tRNA (Xu et al. 2017). Second, the cellular RNA distribution is dominated by rRNA (85%), with tRNA accounting for 10%–12% and mRNA only 2%–5% (Lodish et al. 2000). Thus, tRNA is more abundant than mRNA. Third, tRNAs are shorter and less diverse compared with poly(A) RNAs such as mRNA. Taken together, the amount of m3C at each site is therefore considerably lower in poly(A) RNA than in tRNA. Moreover, the m3C distribution differs markedly between tRNA and poly(A) RNA. In tRNA, m3C is primarily located within the GGNCU motif at position 32 in the anticodon loop (Cui et al. 2021; Bohnsack et al. 2022), whereas in poly(A) RNA, the m3C sites are predominantly located within the CC motif and are relatively uniformly distributed across transcripts. These differences suggest that the mechanism of m3C incorporation into poly(A) RNA may be distinct from that in tRNA. Notably, reanalysis of previous AlkAniline-Seq data sets revealed that some of our identified m3C sites showed cleavage patterns consistent with m3C modification, providing additional validation for our findings. The limited overlap may be attributable to several factors, including the focus of AlkAniline-Seq on tRNAs and short RNAs, and the fact that our approach specifically identifies METTL2A-mediated m3C sites, which represent only a subset of all m3C sites, and differences in cell lines (293 cells, Capan-1 cells, and PANC-1 cells in the AlkAniline-Seq data set vs. AsPC-1 cells in our study). Nevertheless, the detection of overlapping sites between the two data sets provides independent support for the validity of our method.
A notable aspect of this study is its suggestion of functional roles for m3C in poly(A) RNA. Initially, we found that approximately half of the m3C RNAs were upregulated upon METTL2A knockdown. Moreover, METTL2A-mediated m3C modification may regulate S100A4 isoform expression, as, following METTL2A knockdown, the S100A4-201 isoform not only showed the most significant change in isoform percentage but also exhibited isoform-specific shifts in current intensity near the relevant exon. Furthermore, the enrichment of translation-related processes in the m3C RNA and the enrichment of m3C sites in the coding sequences suggest that m3C in poly(A) RNA may play roles in translation, consistent with previous studies showing that m3C in tRNA is required for mRNA translation (Schöller et al. 2021; Cui et al. 2024). Because both tRNA and mRNA are involved in translation, m3C may regulate translation via both molecules. However, how m3C is recognized and regulated in poly(A) RNA remains unclear; it is possible that unknown reader proteins recognize m3C in poly(A) RNA. Further research is needed to identify these potential reader proteins and clarify their roles in m3C regulation.
Several studies have linked m3C writers to the development of human diseases, including cancer (Ignatova et al. 2020; Lentini et al. 2020; Schöller et al. 2021; Wang et al. 2022). In this study, we have demonstrated that METTL2A is upregulated in several cancers, including pancreatic cancer, compared with normal tissues, and is required for pancreatic cancer cell proliferation, possibly through the regulation of RNAs related to the cell cycle and cell division. Consistent with our results, METTL2A is upregulated in breast invasive carcinoma and regulates cell cycle-related pathways (Wang et al. 2022). Moreover, METTL2A plays an essential role in the growth of MCF-7 human breast cancer cells (Cui et al. 2024). Our finding that MT-mRNA and MT-rRNA are modified and regulated by METTL2A is intriguing, as previous studies have suggested a link between mitochondrial function and m3C modification (Lentini et al. 2020; Schöller et al. 2021). Several groups have reported that METTL8 regulates mitochondrial translation and respiratory activity through m3C modifications of MT-tRNA (Schöller et al. 2021; Kleiber et al. 2022; Lentini et al. 2022). In addition, METTL2A forms a complex with DALRD3, and a mutation in the DALRD3 gene that reduces m3C formation in cytoplasmic tRNAArg can cause epileptic encephalopathy, which is often linked to mitochondrial dysfunction (Yasukawa et al. 2000, 2001; Kirino et al. 2004, 2005; Zsurka and Kunz 2015; Lentini et al. 2020; Rho and Boison 2022).
In conclusion, using direct RNA sequencing, we identified METTL2A-mediated m3C sites in poly(A) RNA and showed that the CC motif is enriched in these sites. We further elucidated that METTL2A downregulates these m3C RNAs. Our approach may contribute to uncovering the functions and characteristics of unknown RNA modifications regulated by diverse factors.
Methods
Cell culture
AsPC-1 cells (American Type Culture Collection [ATCC]) were cultured in RPMI-1640 with L-glutamine and phenol red (Wako, #189-02025) supplemented with 10% fetal bovine serum (FBS), 1 mM sodium pyruvate (Wako, #190-14881), 10 mM HEPES (Wako, #345-06681), and D(+)-glucose (final concentration of 4.5 g/L; Wako, #079-05511). PANC-1 cells (ATCC) were cultured in D-MEM (High Glucose) with L-glutamine and phenol red (Wako, #044-29765) supplemented with 10% FBS and 1 mM sodium pyruvate. SUIT-2 cells (Japanese Collection of Research Bioresources [JCRB] Cell Bank, #JCRB1094) were cultured in RPMI-1640 with L-glutamine and phenol red (Wako, #189-02025) supplemented with 10% FBS and 1 mM sodium pyruvate.
Molecular cloning
The construct for expressing FLAG-tagged METTL2A (pcDNA3.1-FLAG-METTL2A) was generated by amplifying the open reading frame (ORF) of METTL2A from AsPC-1 cell cDNA using PrimeSTAR GXL DNA Polymerase (Takara, #R050A) and inserting it into the EcoRV and XhoI restriction sites of pcDNA3.1 C-FLAG using the Ligation-Convenience kit (Nippon Gene, #315-05963). The base editor construct targeting the S100A4-201 m3C sites was generated by cloning a guide RNA (gRNA) sequence—designed to target the 5′ region of the third exon of S100A4-201—into the BbsI restriction sites of gCBE v3 (Tong et al. 2024) (Addgene, plasmid #220618) using the In-Fusion Snap Assembly Master Mix (Takara, #638947). All inserted sequences were confirmed by Sanger sequencing. The primer sequences used are listed in Supplemental Table S2.
Establishment of S100A4 mutant cell line
AsPC-1 cells were transfected with the base editor construct targeting the S100A4-201 m3C sites. At 24 h posttransfection, cells were resuspended in ice-cold HBSS (Wako, #085-09355). mCherry-positive cells were sorted as single cells into individual wells of four 96-well plates using a BD FACS Aria IIIu flow cytometer (BD Biosciences). After clonal expansion, genomic DNA was extracted from each clone using the SimplePrep reagent for DNA (Takara, #9180) and screened for mutations by quantitative PCR (qPCR). Candidate clones were further verified for mutations by Sanger sequencing.
RNA interference
Small interfering RNA (siRNA) duplexes targeting METTL2A were purchased from GeneDesign or Thermo Fisher Scientific. Cells were transfected with RNA duplexes using Lipofectamine RNAiMAX Transfection Reagent (Thermo Fisher Scientific, #13778500) according to the manufacturer's protocol. The siRNA sequences are shown in Supplemental Table S3.
Expression of m3C writers in tumor tissues
The relative expression levels of each m3C writer in tumor tissues compared with their normal tissues across various cancers was analyzed using The Cancer Genome Atlas (TCGA) and the Genotype-Tissue Expression (GTEx) data sets (Lonsdale et al. 2013). The normalized count data (RSEM expected_count output normalized using DESeq2) were downloaded from the UCSC Xena platform (Goldman et al. 2020). The relative expression levels of m3C writers in tumor samples were calculated by normalizing the expression level in each sample to the median of the corresponding normal tissue. The relative expression levels of m3C writers between tumor and normal tissues were compared using the Wilcoxon test.
Correlation between the expression of m3C writers and patient survival
The association between the expression of m3C writers and patient survival for each cancer type was analyzed using the TCGA data set. Patient survival data from the TCGA Pan-Cancer Clinical Data Resource (TCGA-CDR) data set (Liu et al. 2018) were downloaded from UCSC Xena (Goldman et al. 2020). Patients were categorized into high- and low-expression groups by comparing the expression of each m3C writer with the median. The association between the expression of each m3C writer and patient survival in each cancer type was evaluated using the Cox proportional hazards model with the coxph function from the survival R package (version 35-0, https://cran.r-project.org/web/packages/survival/vignettes/survival.pdf). Kaplan–Meier plots were generated using both the survival and survminer R packages (https://github.com/kassambara/survminer).
RT-qPCR
After isolating RNA using EconoSpin for RNA, gDNA removal and reverse transcription to cDNA were performed using the PrimeScript RT Reagent kit with gDNA eraser (Takara, #RR047B). RT-qPCR analysis of cDNA was performed on a Thermal Cycler Dice Real-Time System (Takara Bio) using TB Green Premix Ex Taq II (Takara Bio, #RR820L). Primer sequences are listed in Supplemental Table S4.
CellTiter-Glo assay
Cell viability was determined using the CellTiter-Glo 2.0 Cell Viability Assay kit (Promega, #G9241) according to the manufacturer's protocol, with minor modifications. After seeding on a 96-well plate for 24 h, cells were transfected with siRNA targeting METTL2A. At 96 h posttransfection, the medium was removed and 100 µL of CellTiter-Glo 2.0 Reagent, diluted four-fold in phosphate-buffered saline (PBS), were added to each well. The cells were then incubated for 10 min. Luminescence was measured using a GloMax Discover Microplate Reader (Promega, #GM3000).
Direct RNA sequencing
RNA was isolated using a NucleoSpin RNA mini kit (MACHEREY-NAGEL, #740955), treated with Recombinant DNase I (Takara, #2270A) and Recombinant RNase Inhibitor (Takara, #2313A) for 20 min at 37°C and purified using a Nucleospin RNA Clean-up kit (MACHEREY-NAGEL, #740948). Direct RNA sequencing was performed on the PromethION platform (Oxford Nanopore Technologies) using a FLO-PRO002 flow cell and the SQK-RNA002 kit.
Quantification of nanopore DRS reads
FAST5 files were basecalled using ONT Guppy (version 6.4.6). The basecalled reads were mapped to the human genome (GRCh38.p13) using minimap2 (version 2.24-r1122) (Li 2018) with the following parameters: -x splice -uf -k14. Transcript isoforms were quantified using ESPRESSO (version 1.3.1) (Gao et al. 2023) as follows. High-confidence splice junctions were determined using ESPRESSO_S, based on annotations from the GENCODE project (Frankish et al. 2023) (Human Release 43), followed by the correction and recovery of splice junctions for each read using ESPRESSO_C. All isoforms were identified and quantified using ESPRESSO_Q. Count data generated by ESPRESSO were analyzed with DESeq2 (version 1.38.3) (Love et al. 2014). Transcripts with a P-value < 0.05 were considered to be differentially expressed. Functional enrichment analysis was performed using the gost function in the gprofiler2 package (version 0.2.3) (Peterson et al. 2020). Poly(A) tail lengths were estimated using the polya command in nanopolish (version 0.14.0) (Stoiber et al. 2016; Workman et al. 2019).
Detection of METTL2A-mediated m3C modification sites
The basecalled reads were mapped to the human transcriptome using minimap2 with the following parameters: -x map-ont (Li 2018). The human transcriptome was generated from the ESPRESSO-corrected GTF file using GffRead (version 0.12.7) (Pertea and Pertea 2020). The mapped reads were then filtered using SAMtools (version 1.9) (Li et al. 2009) to retain only primary alignments mapped on the forward strand (-F 2324). Current signals at each transcript position were analyzed across different conditions. The filtered mapped reads were indexed using the index command in nanopolish (version 0.14.0) (Loman et al. 2015; Simpson et al. 2017), and the raw signals were aligned to the filtered reads using the eventalign command in nanopolish (Loman et al. 2015; Simpson et al. 2017). The aligned data were collapsed every five nucleotides and indexed using the eventalign_collapse command in Nanocompore (version 1.0.4) (Leger et al. 2021; Mulroney et al. 2023). The median signal intensity and the scaled log10-transformed dwell time were compared between control and METTL2A-knockdown conditions using either the Kolmogorov–Smirnov (KS) test or a Gaussian mixture model followed by a logistic regression test (GMM-logit) through the sampcomp command in Nanocompore (Leger et al. 2021). Sites where the parameters consistently changed (P-value < 0.05) under both siRNAs targeting METTL2A were identified as sites with parameter variation. Sequence logos for k-mer sequences with changes in the current signal parameter were generated using WebLogo (version 3.7.9) (Crooks et al. 2004). MEME motif analysis was performed using MEME-ChIP (version 5.5.5) (Machanick and Bailey 2011) with the following parameters: -minw 5 -maxw 15.
Analysis of AlkAniline-Seq data
FASTQ files of AlkAniline-Seq were downloaded from the European Nucleotide Archive (ENA; https://www.ebi.ac.uk/ena/browser/home), accession number PRJEB45091. The raw FASTQ files were preprocessed using fastp (version 0.23.2) (Chen et al. 2018), and the preprocessed FASTQ files were mapped to the human genome (GRCh38.p13) using STAR (version 2.7.10) (Dobin et al. 2013) along with the ESPRESSO-corrected GTF file. The resulting BAM files were converted to bed12 files using BEDTools (2.31.0) (Quinlan and Hall 2010), and gene information was annotated accordingly. Cleavage sites for each read were determined based on the assumption that the beginning of Read1 corresponds to the N+1 nucleotide. The m3C sites identified in this study were converted to genomic coordinates using gppy (https://github.com/mt1022/gppy), and their overlap with the cleavage sites identified by AlkAniline-Seq was analyzed.
Estimation of m3C stoichiometry
The m3C stoichiometry at each m3C site was estimated using a Gaussian mixture model. The distribution of current intensities at each m3C site was modeled as a mixture of two normal distributions, corresponding to modified and unmodified sequences. First, the parameters of these two distributions were estimated using the normalmixEM function in the mixtools package (Benaglia et al. 2009) based on data pooled from all samples. Subsequently, the mixing proportions for each sample were determined using the same function with the distribution parameters held fixed. Of the two distributions, the one with the lower mean was assigned to the m3C-modified sequence. Two-tailed, unpooled Z-tests were performed on the modification-rate differences of the two conditions for each position, following a similar approach used in xPore (Pratanwanich et al. 2021). The average of read coverages and modification rates across replicates for each condition were used to compute the Z-score.
Characterization of the METTL2A-mediated m3C sites
Functional enrichment analysis was performed using the gost function in the gprofiler2 package (Peterson et al. 2020). The relative positions of m3C sites within RNAs were calculated and visualized using custom scripts, where the transcription start site (TSS) was set to 0 and the transcription end site (TES) to 1. Each m3C site in mRNAs was assessed for its location in the 5′ untranslated region (UTR), coding sequence, or 3′ UTR. The relative positions within these regions were then calculated, with 0 representing the start of the region and 1 representing the end. Kernel density estimations were calculated and visualized using the geom_density function from the ggplot2 package (version 3.5.1).
Associations with loop structures
The localization of each m3C site within a loop structure was inferred based on the predicted RNA secondary structure. First, the secondary structures of RNAs were predicted using RNAfold in ViennaRNA package (Lorenz et al. 2011). The dot-bracket notation corresponding to each m3C site was then extracted to determine whether the site was located within a loop structure. RNA structuredness was calculated as previously described (Kurosaki et al. 2022). Specifically, the minimum free energy (MFE) for each mRNA was calculated using RNALfold (Hofacker et al. 2004) in the ViennaRNA package (Lorenz et al. 2011). The structuredness of mRNA was then defined as the MFE divided by RNA length, as described previously (Fischer et al. 2020).
Isoform expression and m3C mapping
Changes in isoform expression following METTL2A knockdown were calculated by determining the percentage of expression of each isoform within each gene for each sample. These percentages were then compared between the METTL2A-knockdown and control conditions. The P-values were determined using Student's t-test and adjusted for false discovery rate (FDR). BAM files were converted to bedGraph format using deepTools (version 3.5.2) (Ramírez et al. 2016). The genomic coordinates of the exons for each transcript were extracted from the BED12 files, which were generated by converting the GTF file with AGAT (version 1.1.0) (Dainat et al. 2024). These coordinates were then used to map each m3C site from transcript coordinates to genomic coordinates.
Short-read RNA-seq data analysis
FASTQ files were preprocessed using fastp (version 0.23.2) (Chen et al. 2018), and the preprocessed FASTQ files were mapped to the human genome (GRCh38.p13) using STAR (version 2.7.10) (Dobin et al. 2013) along with the ESPRESSO-corrected GTF file. The number of reads mapped to each transcript was quantified with StringTie (version 2.2.1) (Pertea et al. 2016), and the transcript-level counts were summarized to gene-level counts using tximport (version 1.26.1) (Soneson et al. 2015). Differential gene expression analysis was performed with DESeq2 (Love et al. 2014). Differentially expressed genes (DEGs) were defined as those with a P-value < 0.05. Functional enrichment analysis was performed using the gost function from the gprofiler2 package (Kolberg et al. 2020).
Immunofluorescence
AsPC-1 cells were seeded on coverslips and transfected with pcDNA3.1 FLAG-METTL2A or pcDNA3.1 C-FLAG vector the next day. After 48 h of transfection, the cells were incubated with MitoBright IM Red for Immunostaining (Dojindo, #MT15) in RPMI medium at 37°C for 30 min. After washing with PBS, the cells were fixed in glyoxal fixative solution (Richter et al. 2018) (2.84 mL of H2O, 789 µL of ethanol, 313 µL of 40% glyoxal, 30 µL of acetic acid) at room temperature for 20 min. After washing three times with PBS-T (PBS with 0.2% Tween 20), the cells were permeabilized by treatment with PBS with 0.1% Triton X-100 for 5 min at 4°C. After washing three times with PBS-T, samples were blocked with BSA-T (PBS with 1% BSA and 0.1% Tween 20) for 1 h. Samples were then incubated at 4°C overnight with anti-FLAG M2 antibody (Sigma-Aldrich, #F1804) diluted in BSA-T. After washing three times with PBS-T, samples were incubated at room temperature for 1 h with fluorescent-labeled anti-mouse IgG secondary antibody conjugated with Alexa Fluor 488 (Invitrogen, #A11029) diluted in BSA-T, followed by three washes with PBS-T. For staining nuclei, samples were incubated with 1 μg/mL DAPI solution (Dojindo, #D523) in PBS for 10 min at room temperature. After washing three times with PBS, samples were mounted with ProLong Gold Antifade Mountant (Invitrogen, #P36934) for imaging. Images were acquired with a 63× oil immersion objective in the AiryScan mode of LSM900 (Zeiss). AiryScan processing was performed on the acquired images. Line-scan analysis was performed using Fiji (Schindelin et al. 2012).
Subcellular fractionation followed by immunoblotting
AsPC-1 cells expressing FLAG-tagged METTL2A or FLAG were fractionated using the REAP method (Suzuki et al. 2010) with minor modifications. The day after seeding AsPC-1 cells in 10-cm dishes, the cells were transfected with pcDNA3.1 FLAG-METTL2A or pcDNA3.1 C-FLAG. After 48 h of transfection, the cells were washed with ice-cold PBS, scraped, and collected into 1.5-mL tubes. Following centrifugation at 600g for 3 min, the cell pellets were resuspended in 900 µL of ice-cold 0.1% IGEPAL CA-630 (Sigma-Aldrich, #I8896) in PBS by pipetting five times. From the resulting lysate, 90 µL were removed as the whole-cell lysate and mixed with 30 µL of 4× Laemmli sample buffer (Tokyo Chemical Industry, #B6104). The remaining lysate was centrifuged at 2000g for 1 min, and 150 µL of the supernatant were transferred to a new tube and centrifuged again at 2000g for 1 min. The cytoplasmic fraction was prepared by collecting 90 µL of the resulting supernatant and mixing it with 30 µL of 4× Laemmli sample buffer. The pellet obtained from the initial centrifugation at 2000g was resuspended in 1 mL of ice-cold 0.1% IGEPAL CA-630 in PBS, centrifuged again at 2000g for 1 min, and the resulting pellet was resuspended in 1× Laemmli sample buffer to obtain the nuclear fraction. The whole-cell lysate and nuclear fraction were sonicated using a Bioruptor (Sonicbio, #UCD-250). All fractions were boiled for 3 min. The boiled samples were resolved by SDS-PAGE using 4%–15% Mini-PROTEAN TGX Precast Protein Gels (Bio-Rad, #4561086) and transferred to polyvinylidene difluoride (PVDF) membranes (Merck Millipore, Immobilon-P, #IPVH00010). After blocking with Bullet Blocking One for Western Blotting (Nacalai Tesque, #13779-01) for 5 min at room temperature, membranes were incubated with anti-FLAG M2 antibody (Sigma-Aldrich, #F1804), anti-GAPDH antibody (Sigma-Aldrich, #MAB374), or anti-Lamin A/C antibody (abcam, #ab8984) diluted in IMMUNO SHOT Reagent 1 (Cosmo Bio, #IS-001-250). After washing with TBST (20 mM Tris-HCl [pH 7.5], 150 mM NaCl, 0.1% Tween-20), membranes were incubated with HRP-conjugated anti-mouse IgG antibody (Nacalai Tesque, #21860-74) diluted in IMMUNO SHOT Reagent 2 (Cosmo Bio, #IS-002-250) for 1 h at room temperature. After washing with TBST, signals were visualized using Immobilon Forte Western HRP substrate (Merck Millipore, #WBKLS0500) and the LAS-4000UVmini Luminescent Image Analyzer (Fujifilm).
Data access
The data sets generated during the current study have been submitted to the DNA Data Bank of Japan (DDBJ) Sequence Read Archive (DRA; https://www.ddbj.nig.ac.jp/dra/) under accession numbers DRR454972–DRR454980 (short-read FASTQ files), DRR454987–DRR454995 (long-read FASTQ files), and DRZ139089–DRZ139106 (long-read FAST5 files). All custom-made code used in this study is available at GitHub (https://github.com/s-mitsutomi-ric/METTL2A_comparative_DRS) and as Supplemental Code.
Competing interest statement
The authors declare no competing interests.
Acknowledgments
This work was supported by the Japan Society for the Promotion of Science (JSPS) (Grant Numbers JP21H02758 [K.Taniue], JP21K19402 [K.Taniue], JP21H04792 [N.A.], JP22KJ0965 [S.Mitsutomi], JP22H04925 [Platform for Advanced Genome Science (PAGS)], JP23H04955 [N.A.], JP23K18108 [N.A.], JP24KJ2206 [S.Mitsutomi], JP24K22066 [K.Taniue], and JP22KK0285 [K.Taniue]). N.A. and K.Taniue were supported by Takeda Science Foundation and the Uehara Memorial Foundation. K.Taniue was supported by the MSD Life Science Foundation, the Kobayashi Foundation, and the Naito Foundation. Part of the computations were performed on the NIG supercomputer at ROIS National Institute of Genetics. The results shown here are in part based upon data generated by the TCGA Research Network (https://www.cancer.gov/tcga). We thank Catherine Perfect, MA (Cantab), from Edanz (https://jp.edanz.com/ac), for editing a draft of this manuscript.
Author contributions: S.Mitsutomi and K.Taniue designed the research. S.Mitsutomi, K.Taniue, A.S., S.Miyao, and H.D. performed experiments with assistance from K.Takahashi and Y.M. S.Mitsutomi performed bioinformatic analyses. M.S. and Y.S. performed sequencing analysis. S.Mitsutomi, K.Taniue, and N.A. wrote and revised the manuscript.
Notes
[1] Supplementary material [Supplemental material is available for this article.]
[2] Article published online before print. Article, supplemental material, and publication date are at https://www.genome.org/cgi/doi/10.1101/gr.280269.124.
References
- ↵Acera Mateos P, Sethi AJ, Ravindran A, Srivastava A, Woodward K, Mahmud S, Kanchi M, Guarnacci M, Xu J, Yuen ZWS, 2024. Prediction of m6A and m5C at single-molecule resolution reveals a transcriptome-wide co-occurrence of RNA modifications. Nat Commun 15: 3899. 10.1038/s41467-024-47953-7
- ↵Aguet F, Brown AA, Castel SE, Davis JR, He Y, Jo B, Mohammadi P, Park YS, Parsana P, Segrè AV, 2017. Genetic effects on gene expression across human tissues. Nature 550: 204–213. 10.1038/nature24277
- ↵Anreiter I, Mir Q, Simpson JT, Janga SC, Soller M. 2021. New twists in detecting mRNA modification dynamics. Trends Biotechnol 39: 72–89. 10.1016/j.tibtech.2020.06.002
- ↵Barbieri I, Kouzarides T. 2020. Role of RNA modifications in cancer. Nat Rev Cancer 20: 303–322. 10.1038/s41568-020-0253-2
- ↵Benaglia T, Chauveau D, Hunter DR, Young DS. 2009. mixtools: an R package for analyzing finite mixture models. J Stat Softw 32: 1–29. 10.18637/jss.v032.i06
- ↵Bohnsack KE, Kleiber N, Lemus-Diaz N, Bohnsack MT. 2022. Roles and dynamics of 3-methylcytidine in cellular RNAs. Trends Biochem Sci 47: 596–608. 10.1016/j.tibs.2022.03.004
- ↵Cappannini A, Ray A, Purta E, Mukherjee S, Boccaletto P, Moafinejad SN, Lechner A, Barchet C, Klaholz BP, Stefaniak F, 2024. MODOMICS: a database of RNA modifications and related information. 2023 update. Nucleic Acids Res 52: D239–D244. 10.1093/nar/gkad1083
- ↵Chen S, Zhou Y, Chen Y, Gu J. 2018. fastp: an ultra-fast all-in-one FASTQ preprocessor. Bioinformatics 34: i884–i890. 10.1093/bioinformatics/bty560
- ↵Crooks GE, Hon G, Chandonia JM, Brenner SE. 2004. WebLogo: a sequence logo generator. Genome Res 14: 1188–1190. 10.1101/gr.849004
- ↵Cui J, Liu Q, Sendinc E, Shi Y, Gregory RI. 2021. Nucleotide resolution profiling of m3C RNA modification by HAC-seq. Nucleic Acids Res 49: e27. 10.1093/nar/gkaa1186
- ↵Cui J, Sendinc E, Liu Q, Kim S, Fang JY, Gregory RI. 2024. M3c32 tRNA modification controls serine codon-biased mRNA translation, cell cycle, and DNA-damage response. Nat Commun 15: 5775. 10.1038/s41467-024-50161-y
- ↵Dainat J, Hereñú D, Murray KD, Davis E, Ugrin I, Crouch K, Sol L, Agostinho N, pascal-git, Zollman Z, tayyrov. 2024. NBISweden/AGAT: AGAT-v1.4.1 (v1.4.1). Zenodo. 10.5281/zenodo.13799920
- ↵Dobin A, Davis CA, Schlesinger F, Drenkow J, Zaleski C, Jha S, Batut P, Chaisson M, Gingeras TR. 2013. STAR: ultrafast universal RNA-seq aligner. Bioinformatics 29: 15–21. 10.1093/bioinformatics/bts635
- ↵Fischer JW, Busa VF, Shao Y, Leung AKL. 2020. Structure-mediated RNA decay by UPF1 and G3BP1. Mol Cell 78: 70–84.e6. 10.1016/j.molcel.2020.01.021
- ↵Frankish A, Carbonell-Sala S, Diekhans M, Jungreis I, Loveland JE, Mudge JM, Sisu C, Wright JC, Arnan C, Barnes I, 2023. GENCODE: reference annotation for the human and mouse genomes in 2023. Nucleic Acids Res 51: D942–D949. 10.1093/nar/gkac1071
- ↵Frye M, Harada BT, Behm M, He C. 2018. RNA modifications modulate gene expression during development. Science (1979) 361: 1346–1349. 10.1126/science.aau1646
- ↵Gao Y, Wang F, Wang R, Kutschera E, Xu Y, Xie S, Wang Y, Kadash-Edmondson KE, Lin L, Xing Y. 2023. ESPRESSO: robust discovery and quantification of transcript isoforms from error-prone long-read RNAseq data. Sci Adv 9: eabq5072. 10.1126/sciadv.abq5072
- ↵Garalde DR, Snell EA, Jachimowicz D, Sipos B, Lloyd JH, Bruce M, Pantic N, Admassu T, James P, Warland A, 2018. Highly parallel direct RNA sequencing on an array of nanopores. Nat Methods 15: 201–206. 10.1038/nmeth.4577
- ↵Goldman MJ, Craft B, Hastie M, Repečka K, McDade F, Kamath A, Banerjee A, Luo Y, Rogers D, Brooks AN, 2020. Visualizing and interpreting cancer genomics data via the Xena platform. Nat Biotechnol 38: 675–678. 10.1038/s41587-020-0546-8
- ↵Grozhik AV, Jaffrey SR. 2018. Distinguishing RNA modifications from noise in epitranscriptome maps. Nat Chem Biol 14: 215–225. 10.1038/nchembio.2546
- ↵Hofacker IL, Priwitzer B, Stadler PF. 2004. Prediction of locally stable RNA secondary structures for genome-wide surveys. Bioinformatics 20: 186–190. 10.1093/bioinformatics/btg388
- ↵Ignatova VV, Kaiser S, Ho JSY, Bing X, Stolz P, Tan YX, Lee CL, Gay FPH, Lastres PR, Gerlini R, 2020. METTL6 is a tRNA m3C methyltransferase that regulates pluripotency and tumor cell growth. Sci Adv 6: eaaz4551. 10.1126/sciadv.aaz4551
- ↵Jenjaroenpun P, Wongsurawat T, Wadley TD, Wassenaar TM, Liu J, Dai Q, Wanchai V, Akel NS, Jamshidi-Parsian A, Franco AT, 2021. Decoding the epitranscriptional landscape from native RNA sequences. Nucleic Acids Res 49: e7. 10.1093/nar/gkaa620
- ↵Kirino Y, Yasukawa T, Ohta S, Akira S, Ishihara K, Watanabe K, Suzuki T. 2004. Codon-specific translational defect caused by a wobble modification deficiency in mutant tRNA from a human mitochondrial disease. Proc Natl Acad Sci 101: 15070–15075. 10.1073/pnas.0405173101
- ↵Kirino Y, Goto YI, Campos Y, Arenas J, Suzuki T. 2005. Specific correlation between the wobble modification deficiency in mutant tRNAs and the clinical features of a human mitochondrial disease. Proc Natl Acad Sci 102: 7127–7132. 10.1073/pnas.0500563102
- ↵Kleiber N, Lemus-Diaz N, Stiller C, Heinrichs M, Mai MMQ, Hackert P, Richter-Dennerlein R, Höbartner C, Bohnsack KE, Bohnsack MT. 2022. The RNA methyltransferase METTL8 installs m3C32 in mitochondrial tRNAsThr/Ser(UCN) to optimise tRNA structure and mitochondrial translation. Nat Commun 13: 209. 10.1038/s41467-021-27905-1
- ↵Kolberg L, Raudvere U, Kuzmin I, Vilo J, Peterson H. 2020. gprofiler2 -- an R package for gene list functional enrichment analysis and namespace conversion toolset g:Profiler. F1000Res 9: ELIXIR-709. 10.12688/f1000research.24956.2
- ↵Kong Y, Mead EA, Fang G. 2023. Navigating the pitfalls of mapping DNA and RNA modifications. Nat Rev Genet 24: 363–381. 10.1038/s41576-022-00559-5
- ↵Kurosaki T, Mitsutomi S, Hewko A, Akimitsu N, Maquat LE. 2022. Integrative omics indicate FMRP sequesters mRNA from translation and deadenylation in human neuronal cells. Mol Cell 82: 4564–4581.e11. 10.1016/j.molcel.2022.10.018
- ↵Leger A, Amaral PP, Pandolfini L, Capitanchik C, Capraro F, Miano V, Migliori V, Toolan-Kerr P, Sideri T, Enright AJ, 2021. RNA modifications detection by comparative Nanopore direct RNA sequencing. Nat Commun 12: 7198. 10.1038/s41467-021-27393-3
- ↵Lentini JM, Alsaif HS, Faqeih E, Alkuraya FS, Fu D. 2020. DALRD3 encodes a protein mutated in epileptic encephalopathy that targets arginine tRNAs for 3-methylcytosine modification. Nat Commun 11: 2510. 10.1038/s41467-020-16321-6
- ↵Lentini JM, Bargabos R, Chen C, Fu D. 2022. Methyltransferase METTL8 is required for 3-methylcytosine modification in human mitochondrial tRNAs. J Biol Chem 298: 101788. 10.1016/j.jbc.2022.101788
- ↵Li H. 2018. Minimap2: pairwise alignment for nucleotide sequences. Bioinformatics 34: 3094–3100. 10.1093/bioinformatics/bty191
- ↵Li H, Handsaker B, Wysoker A, Fennell T, Ruan J, Homer N, Marth G, Abecasis G, Durbin R, 1000 Genome Project Data Processing Subgroup. 2009. The Sequence Alignment/Map format and SAMtools. Bioinformatics 25: 2078–2079. 10.1093/bioinformatics/btp352
- ↵Liu J, Lichtenberg T, Hoadley KA, Poisson LM, Lazar AJ, Cherniack AD, Kovatich AJ, Benz CC, Levine DA, Lee AV, 2018. An integrated TCGA pan-cancer clinical data resource to drive high-quality survival outcome analytics. Cell 173: 400–416.e11. 10.1016/j.cell.2018.02.052
- ↵Lodish H, Berk A, Zipursky L, Matsudaira P, Baltimore D, Darnell J. 2000. Molecular cell biology, 4th ed. Freeman and Co., New York.
- ↵Loman NJ, Quick J, Simpson JT. 2015. A complete bacterial genome assembled de novo using only nanopore sequencing data. Nat Methods 12: 733–735. 10.1038/nmeth.3444
- ↵Lonsdale J, Thomas J, Salvatore M, Phillips R, Lo E, Shad S, Hasz R, Walters G, Garcia F, Young N, 2013. The Genotype-Tissue Expression (GTEx) project. Nat Genet 45: 580–585. 10.1038/ng.2653
- ↵Lorenz R, Bernhart SH, Höner zu Siederdissen C, Tafer H, Flamm C, Stadler PF, Hofacker IL. 2011. ViennaRNA package 2.0. Algorithms Mol Biol 6: 26. 10.1186/1748-7188-6-26
- ↵Love MI, Huber W, Anders S. 2014. Moderated estimation of fold change and dispersion for RNA-seq data with DESeq2. Genome Biol 15: 550. 10.1186/s13059-014-0550-8
- ↵Ma CJ, Ding JH, Ye TT, Yuan BF, Feng YQ. 2019. Alkb Homologue 1 demethylates N3-methylcytidine in mRNA of mammals. ACS Chem Biol 14: 1418–1425. 10.1021/acschembio.8b01001
- ↵Machanick P, Bailey TL. 2011. MEME-ChIP: motif analysis of large DNA datasets. Bioinformatics 27: 1696–1697. 10.1093/bioinformatics/btr189
- ↵Mao XL, Li ZH, Huang MH, Wang JT, Zhou JB, Li QR, Xu H, Wang XJ, Zhou XL. 2021. Mutually exclusive substrate selection strategy by human m3C RNA transferases METTL2A and METTL6. Nucleic Acids Res 49: 8309–8323. 10.1093/nar/gkab603
- ↵Marchand V, Ayadi L, Ernst FGM, Hertler J, Bourguignon-Igel V, Galvanin A, Kotter A, Helm M, Lafontaine DLJ, Motorin Y. 2018. AlkAniline-Seq: profiling of m7G and m3C RNA modifications at single nucleotide resolution. Angew Chem - Int Ed Engl 57: 16785–16790. 10.1002/anie.201810946
- ↵Moshitch-Moshkovitz S, Dominissini D, Rechavi G. 2022. The epitranscriptome toolbox. Cell 185: 764–776. 10.1016/j.cell.2022.02.007
- ↵Mulroney L, Birney E, Leonardi T, Nicassio F. 2023. Using nanocompore to identify RNA modifications from direct RNA nanopore sequencing data. Curr Protoc 3: e683. 10.1002/cpz1.683
- ↵Pertea G, Pertea M. 2020. GFF utilities: GffRead and GffCompare. F1000Res 9: 304. 10.12688/f1000research.23297.1
- ↵Pertea M, Kim D, Pertea GM, Leek JT, Salzberg SL. 2016. Transcript-level expression analysis of RNA-seq experiments with HISAT, StringTie and Ballgown. Nat Protoc 11: 1650–1667. 10.1038/nprot.2016.095
- ↵Peterson H, Kolberg L, Raudvere U, Kuzmin I, Vilo J. 2020. gprofiler2 ‐‐ an R package for gene list functional enrichment analysis and namespace conversion toolset g:Profiler. F1000Res 9: ELIXIR-709. 10.12688/f1000research.24956.2
- ↵Pratanwanich PN, Yao F, Chen Y, Koh CWQ, Wan YK, Hendra C, Poon P, Goh YT, Yap PML, Chooi JY, 2021. Identification of differential RNA modifications from nanopore direct RNA sequencing with xPore. Nat Biotechnol 39: 1394–1402. 10.1038/s41587-021-00949-w
- ↵Price AM, Hayer KE, McIntyre ABR, Gokhale NS, Abebe JS, Della Fera AN, Mason CE, Horner SM, Wilson AC, Depledge DP, 2020. Direct RNA sequencing reveals m6A modifications on adenovirus RNA are necessary for efficient splicing. Nat Commun 11: 6016. 10.1038/s41467-020-19787-6
- ↵Quinlan AR, Hall IM. 2010. BEDTools: a flexible suite of utilities for comparing genomic features. Bioinformatics 26: 841–842. 10.1093/bioinformatics/btq033
- ↵Ramírez F, Ryan DP, Grüning B, Bhardwaj V, Kilpert F, Richter AS, Heyne S, Dündar F, Manke T. 2016. deepTools2: a next generation web server for deep-sequencing data analysis. Nucleic Acids Res 44: W160–W165. 10.1093/nar/gkw257
- ↵Rho JM, Boison D. 2022. The metabolic basis of epilepsy. Nat Rev Neurol 18: 333–347. 10.1038/s41582-022-00651-8
- ↵Richter KN, Revelo NH, Seitz KJ, Helm MS, Sarkar D, Saleeb RS, D'Este E, Eberle J, Wagner E, Vogl C, 2018. Glyoxal as an alternative fixative to formaldehyde in immunostaining and super-resolution microscopy. EMBO J 37: 139–159. 10.15252/embj.201695709
- ↵Roundtree IA, Evans ME, Pan T, He C. 2017. Dynamic RNA modifications in gene expression regulation. Cell 169: 1187–1200. 10.1016/j.cell.2017.05.045
- ↵Schindelin J, Arganda-Carreras I, Frise E, Kaynig V, Longair M, Pietzsch T, Preibisch S, Rueden C, Saalfeld S, Schmid B, 2012. Fiji: an open-source platform for biological-image analysis. Nat Methods 9: 676–682. 10.1038/nmeth.2019
- ↵Schöller E, Marks J, Marchand V, Bruckmann A, Powell CA, Reichold M, Mutti CD, Dettmer K, Feederle R, Hüttelmaier S, 2021. Balancing of mitochondrial translation through METTL8-mediated m3C modification of mitochondrial tRNAs. Mol Cell 81: 4810–4825.e12. 10.1016/j.molcel.2021.10.018
- ↵Shi H, Wei J, He C. 2019. Where, when, and how: context-dependent functions of RNA methylation writers, readers, and erasers. Mol Cell 74: 640–650. 10.1016/j.molcel.2019.04.025
- ↵Siegel RL, Miller KD, Fuchs HE, Jemal A. 2022. Cancer statistics, 2022. CA Cancer J Clin 72: 7–33. 10.3322/caac.21708
- ↵Simpson JT, Workman RE, Zuzarte PC, David M, Dursi LJ, Timp W. 2017. Detecting DNA cytosine methylation using nanopore sequencing. Nat Methods 14: 407–410. 10.1038/nmeth.4184
- ↵Soneson C, Love MI, Robinson MD. 2015. Differential analyses for RNA-seq: transcript-level estimates improve gene-level inferences. F1000Res 4: 1521. 10.12688/f1000research.7563.1
- ↵Stoiber MH, Quick J, Egan R, Lee JE, Celniker SE, Neely R, Loman N, Pennacchio L, Brown JB. 2016. De novo identification of DNA modifications enabled by genome-guided nanopore signal processing. bioRxiv 10.1101/094672
- ↵Suzuki K, Bose P, Leong-Quong RY, Fujita DJ, Riabowol K. 2010. REAP: A two minute cell fractionation method. BMC Res Notes 3: 294. 10.1186/1756-0500-3-294
- ↵Tong H, Wang H, Wang X, Liu N, Li G, Wu D, Li Y, Jin M, Li H, Wei Y, 2024. Development of deaminase-free T-to-S base editor and C-to-G base editor by engineered human uracil DNA glycosylase. Nat Commun 15: 4897. 10.1038/s41467-024-49343-5
- ↵Towns WL, Begley TJ. 2012. Transfer RNA methytransferases and their corresponding modifications in budding yeast and humans: activities, predications, and potential roles in human health. DNA Cell Biol 31: 434–454. 10.1089/dna.2011.1437
- ↵Ueda H. 2021. nanoDoc: RNA modification detection using Nanopore raw reads with Deep One-Class Classification. bioRxiv 10.1101/2020.09.13.295089
- ↵Vilfan ID, Tsai YC, Clark TA, Wegener J, Dai Q, Yi C, Pan T, Turner SW, Korlach J. 2013. Analysis of RNA base modification and structural rearrangement by single-molecule real-time detection of reverse transcription. J Nanobiotechnology 11: 8. 10.1186/1477-3155-11-8
- ↵Wang S, Li H, Liu J, Zhang Q, Xu W, Xiang J, Fang L, Xu P, Li Z. 2022. Integrative analysis of m3C associated genes reveals METTL2A as a potential oncogene in breast cancer. J Transl Med 20: 476. 10.1186/s12967-022-03683-2
- ↵Weinstein JN, Collisson EA, Mills GB, Shaw KRM, Ozenberger BA, Ellrott K, Sander C, Stuart JM, Chang K, Creighton CJ, 2013. The Cancer Genome Atlas Pan-Cancer analysis project. Nat Genet 45: 1113–1120. 10.1038/ng.2764
- ↵Wiener D, Schwartz S. 2021. The epitranscriptome beyond m6A. Nat Rev Genet 22: 119–131. 10.1038/s41576-020-00295-8
- ↵Workman RE, Tang AD, Tang PS, Jain M, Tyson JR, Razaghi R, Zuzarte PC, Gilpatrick T, Payne A, Quick J, 2019. Nanopore native RNA sequencing of a human poly(A) transcriptome. Nat Methods 16: 1297–1305. 10.1038/s41592-019-0617-2
- ↵Wu Y, Shao W, Yan M, Wang Y, Xu P, Huang G, Li X, Gregory BD, Yang J, Wang H, 2024. Transfer learning enables identification of multiple types of RNA modifications using nanopore direct RNA sequencing. Nat Commun 15: 4049. 10.1038/s41467-024-48437-4
- ↵Xiao W, Adhikari S, Dahal U, Chen YS, Hao YJ, Sun BF, Sun HY, Li A, Ping XL, Lai WY, 2016. Nuclear m6A reader YTHDC1 regulates mRNA splicing. Mol Cell 61: 507–519. 10.1016/j.molcel.2016.01.012
- ↵Xu L, Liu X, Sheng N, Oo KS, Liang J, Chionh YH, Xu J, Ye F, Gao YG, Dedon PC, 2017. Three distinct 3-methylcytidine (m3C) methyltransferases modify tRNA and mRNA in mice and humans. J Biol Chem 292: 14695–14703. 10.1074/jbc.M117.798298
- ↵Yasukawa T, Suzuki T, Suzuki T, Ueda T, Ohta S, Watanabe K. 2000. Modification defect at anticodon wobble nucleotide of mitochondrial tRNAsLeu(UUR) with pathogenic mutations of mitochondrial myopathy, encephalopathy, lactic acidosis, and stroke-like episodes. J Biol Chem 275: 4251–4257. 10.1074/jbc.275.6.4251
- ↵Yasukawa T, Suzuki T, Ishii N, Ohta S, Watanabe K. 2001. Wobble modification defect in tRNA disturbs codon-anticodon interaction in a mitochondrial disease. EMBO J 20: 4794–4802.
- ↵Zhang F, Yoon K, Zhang DY, Kim NS, Ming GL, Song H. 2023. Epitranscriptomic regulation of cortical neurogenesis via Mettl8-dependent mitochondrial tRNA m3C modification. Cell Stem Cell 30: 300–311. 10.1016/j.stem.2023.01.007
- ↵Zsurka G, Kunz WS. 2015. Mitochondrial dysfunction and seizures: the neuronal energy crisis. Lancet Neurol 14: 956–966. 10.1016/S1474-4422(15)00148-9