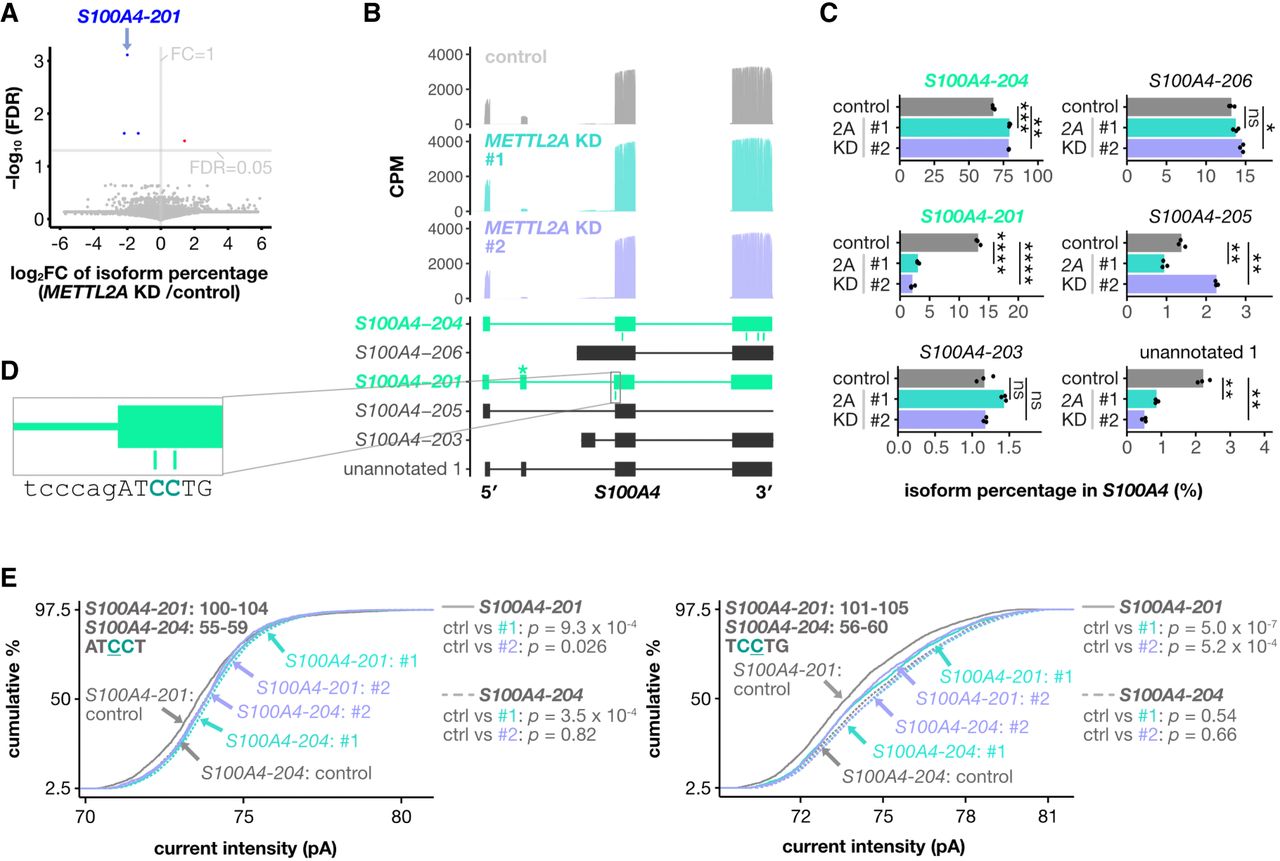
m3C sites near exon junctions contribute to exon skipping in S100A4 mRNA. (A) Volcano plot showing the changes in isoform percentages across all RNAs on METTL2A knockdown. Isoforms with a significant increase are highlighted in red, and those with a significant decrease are shown in blue. (B) Mapping patterns of S100A4 isoforms in direct RNA sequencing under each condition. Methylated isoforms are highlighted in green, with m3C sites indicated in green below the mapping for each sample. The second exon of S100A4 is marked with an asterisk (*). (C) Bar plots showing the percentage of each S100A4 isoform expressed under each condition. (D) The surrounding sequence of the S100A4-201-specific m3C sites. Exon sequences are shown in uppercase and intron sequences in lowercase. (E) Cumulative percentage of current intensity at the corresponding positions of the two isoforms under each condition. P-values were calculated using Nanocompore. In B and C, only isoforms representing more than 1% of the reads for the gene are shown.