
High-density haplotyping with microarray-based expression and single feature polymorphism markers in Arabidopsis
Supplementary Figure 9, West et al.
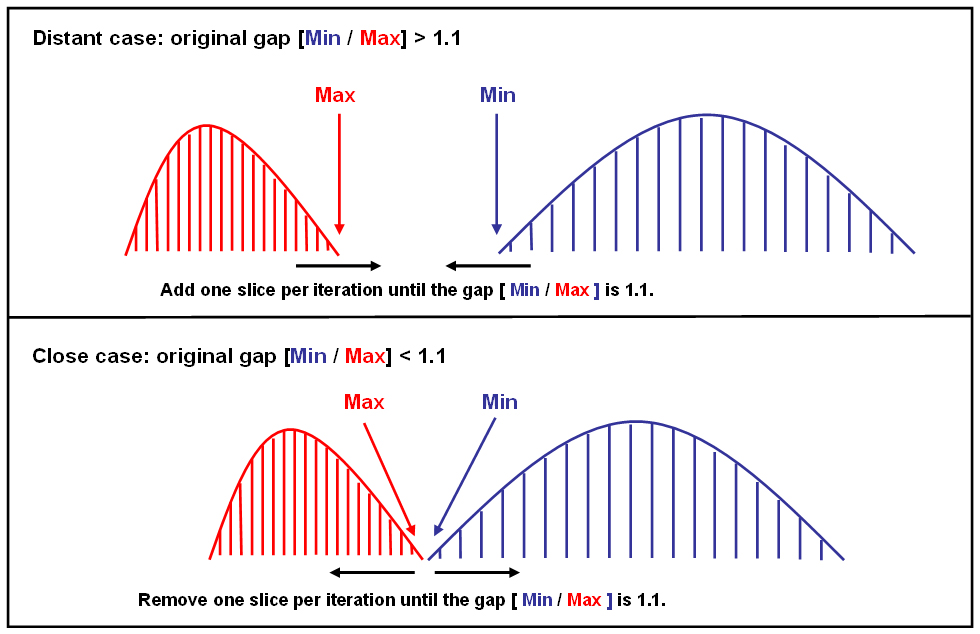
Supplementary Figure 9. Distributions of parental gene expression levels. Gene expression levels are shown on the x-axis, while frequency is indicated on the y-axis. The slicing method adds or removes one slice at a time from each distribution until the adjusted gap value equals 1.1.
This Article
-
Genome Res. June 2006 vol. 16 no. 6 787-795

