
High-density haplotyping with microarray-based expression and single feature polymorphism markers in Arabidopsis
Supplementary Figure 6, West et al.
Click on the images to open a new window with a larger high-resolution image.
A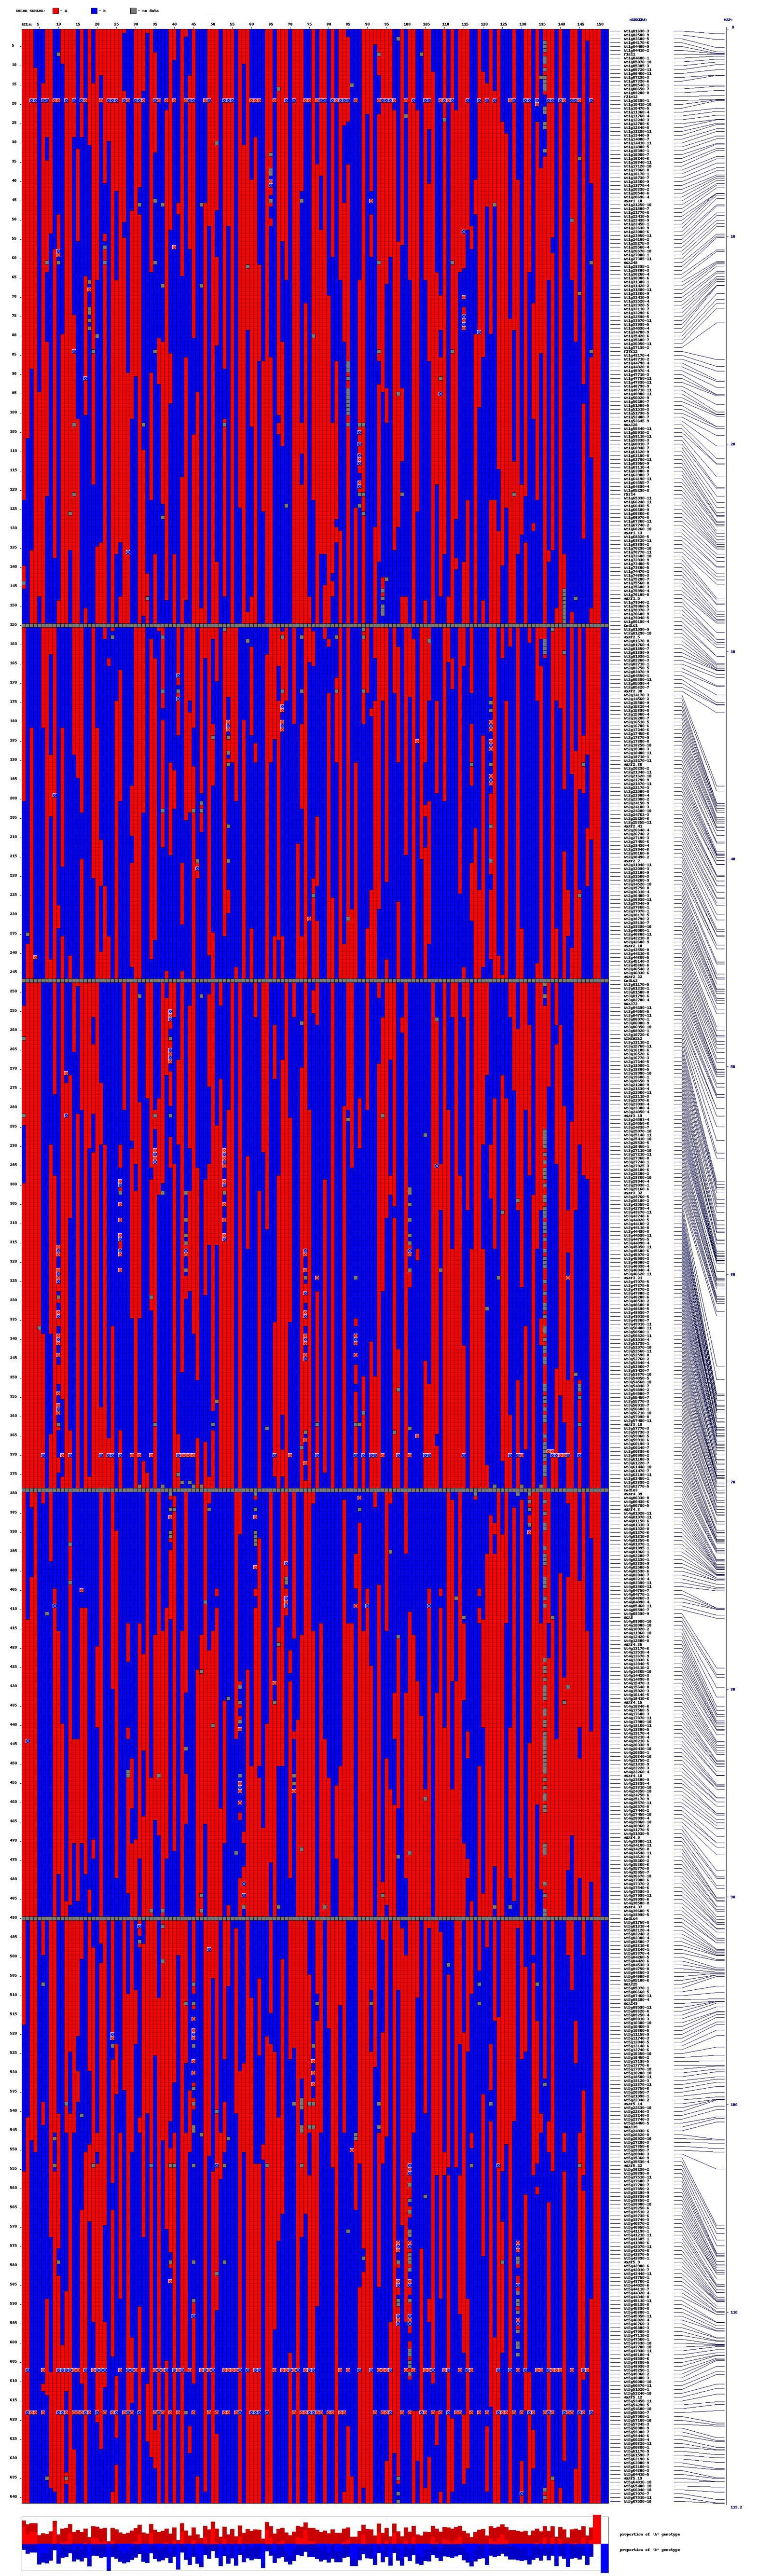 |
B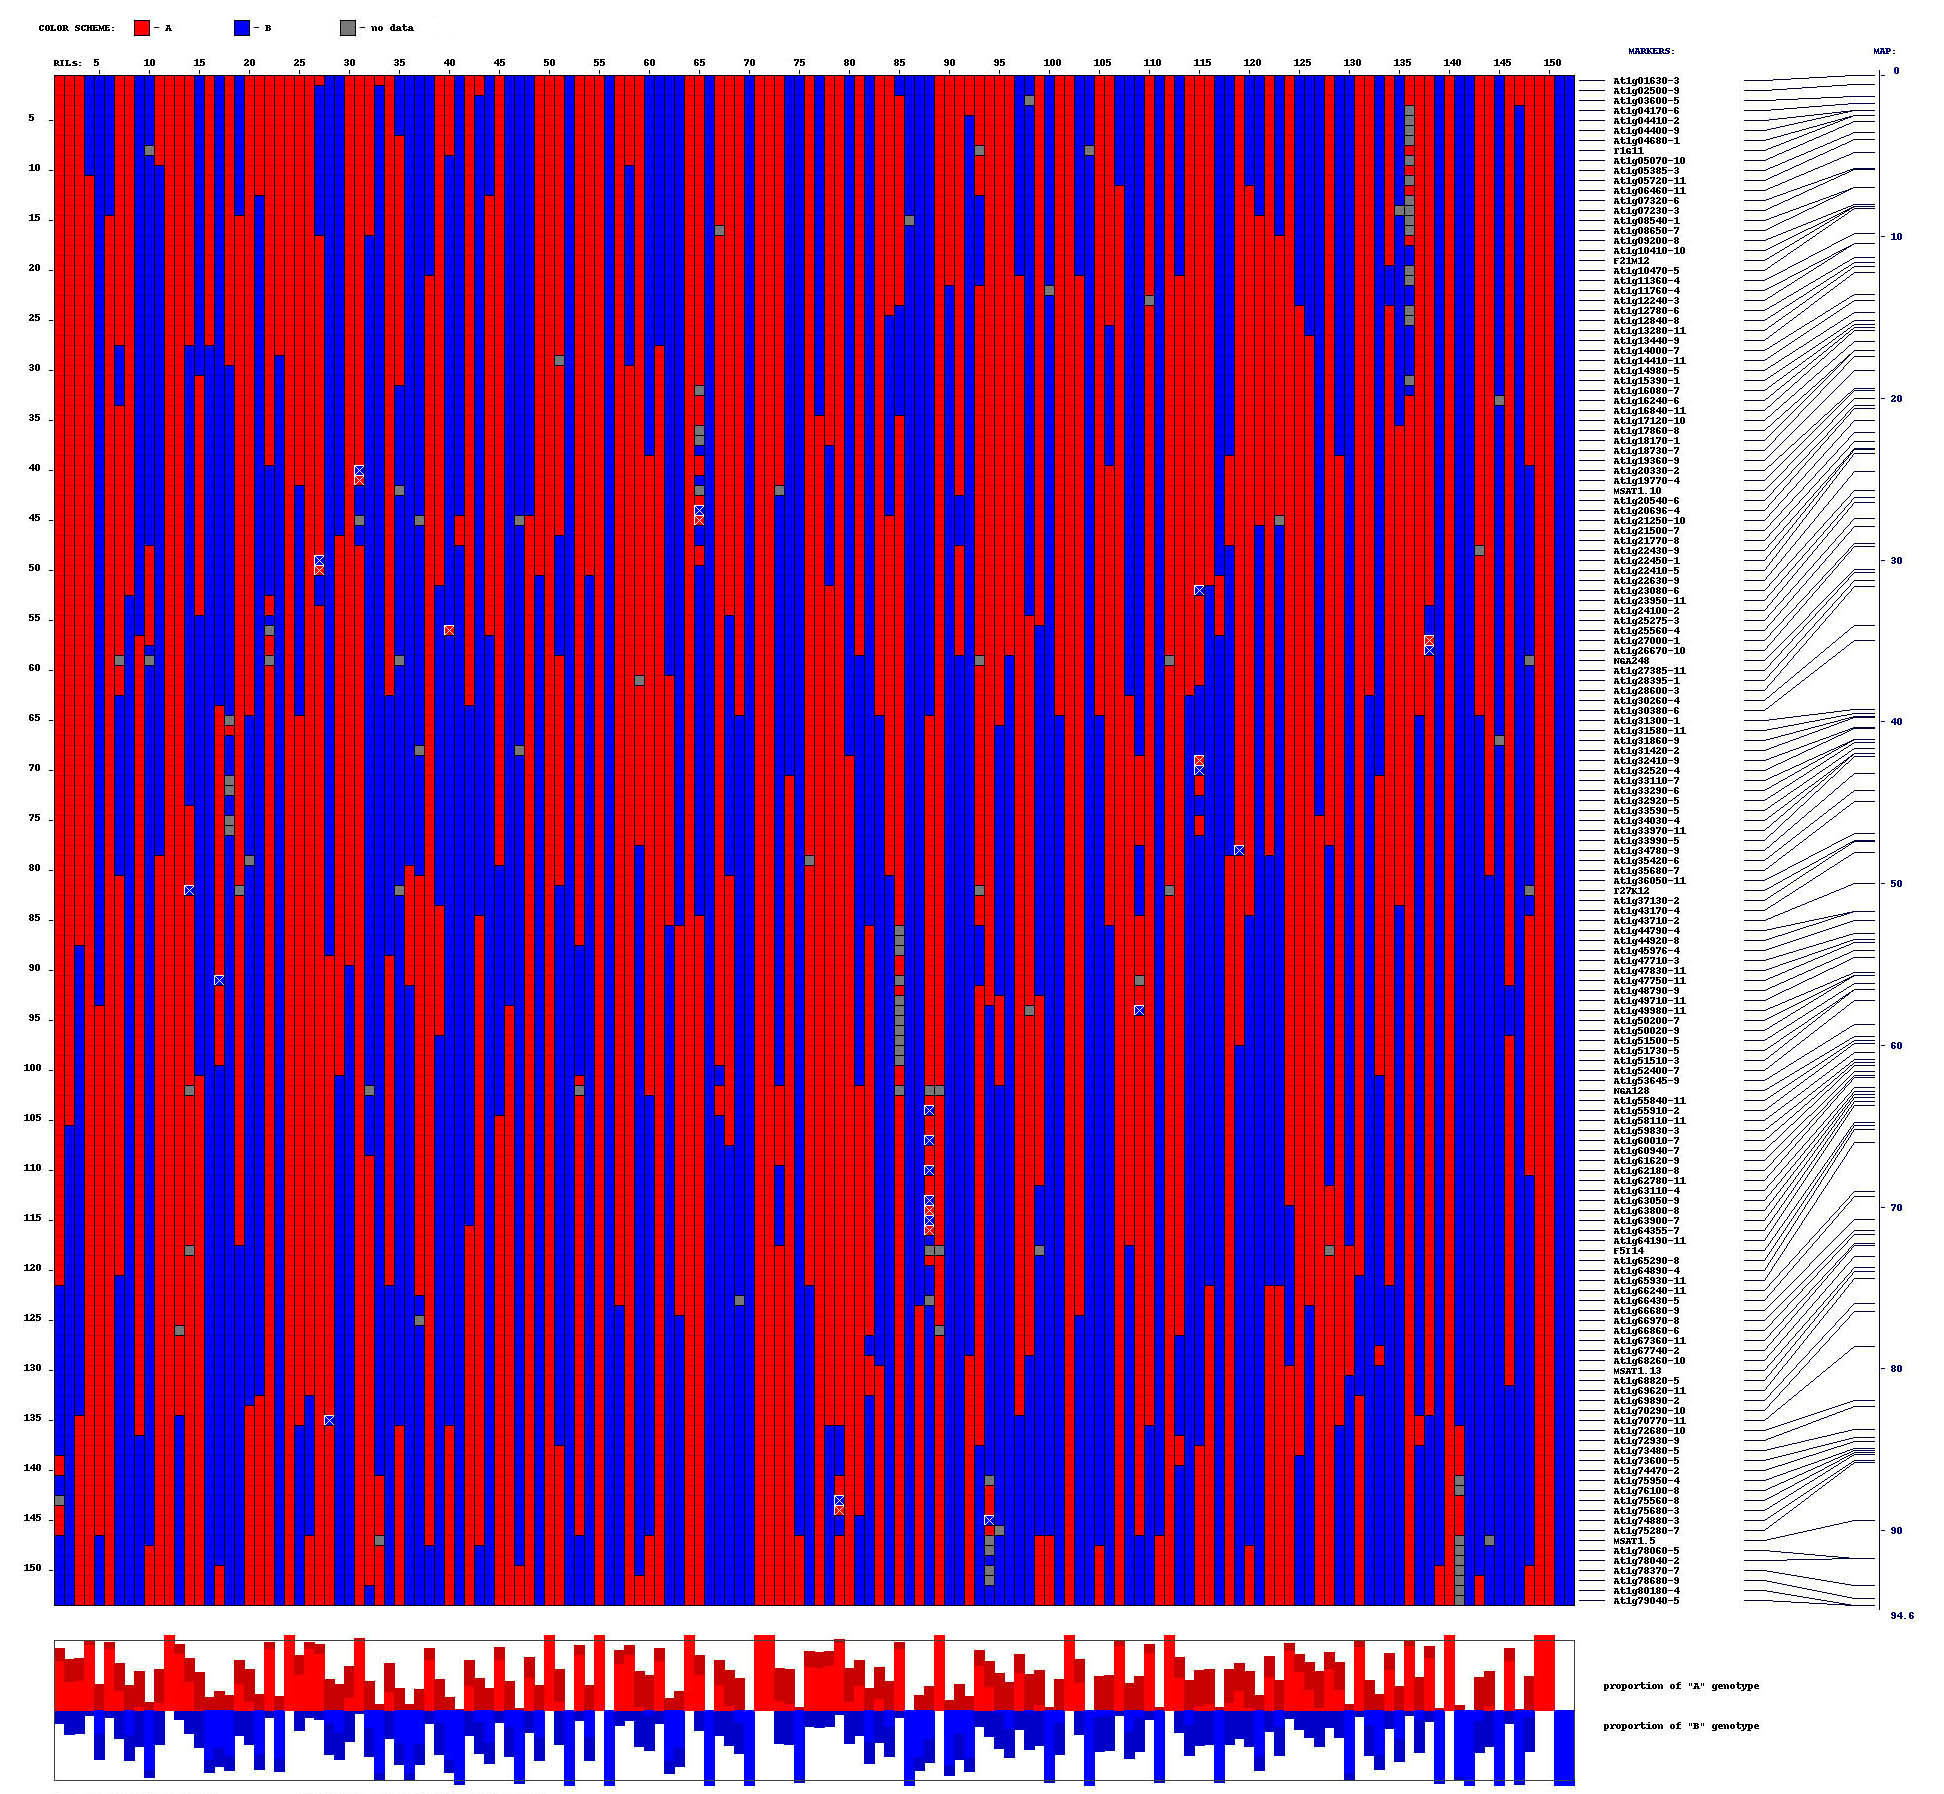 |
C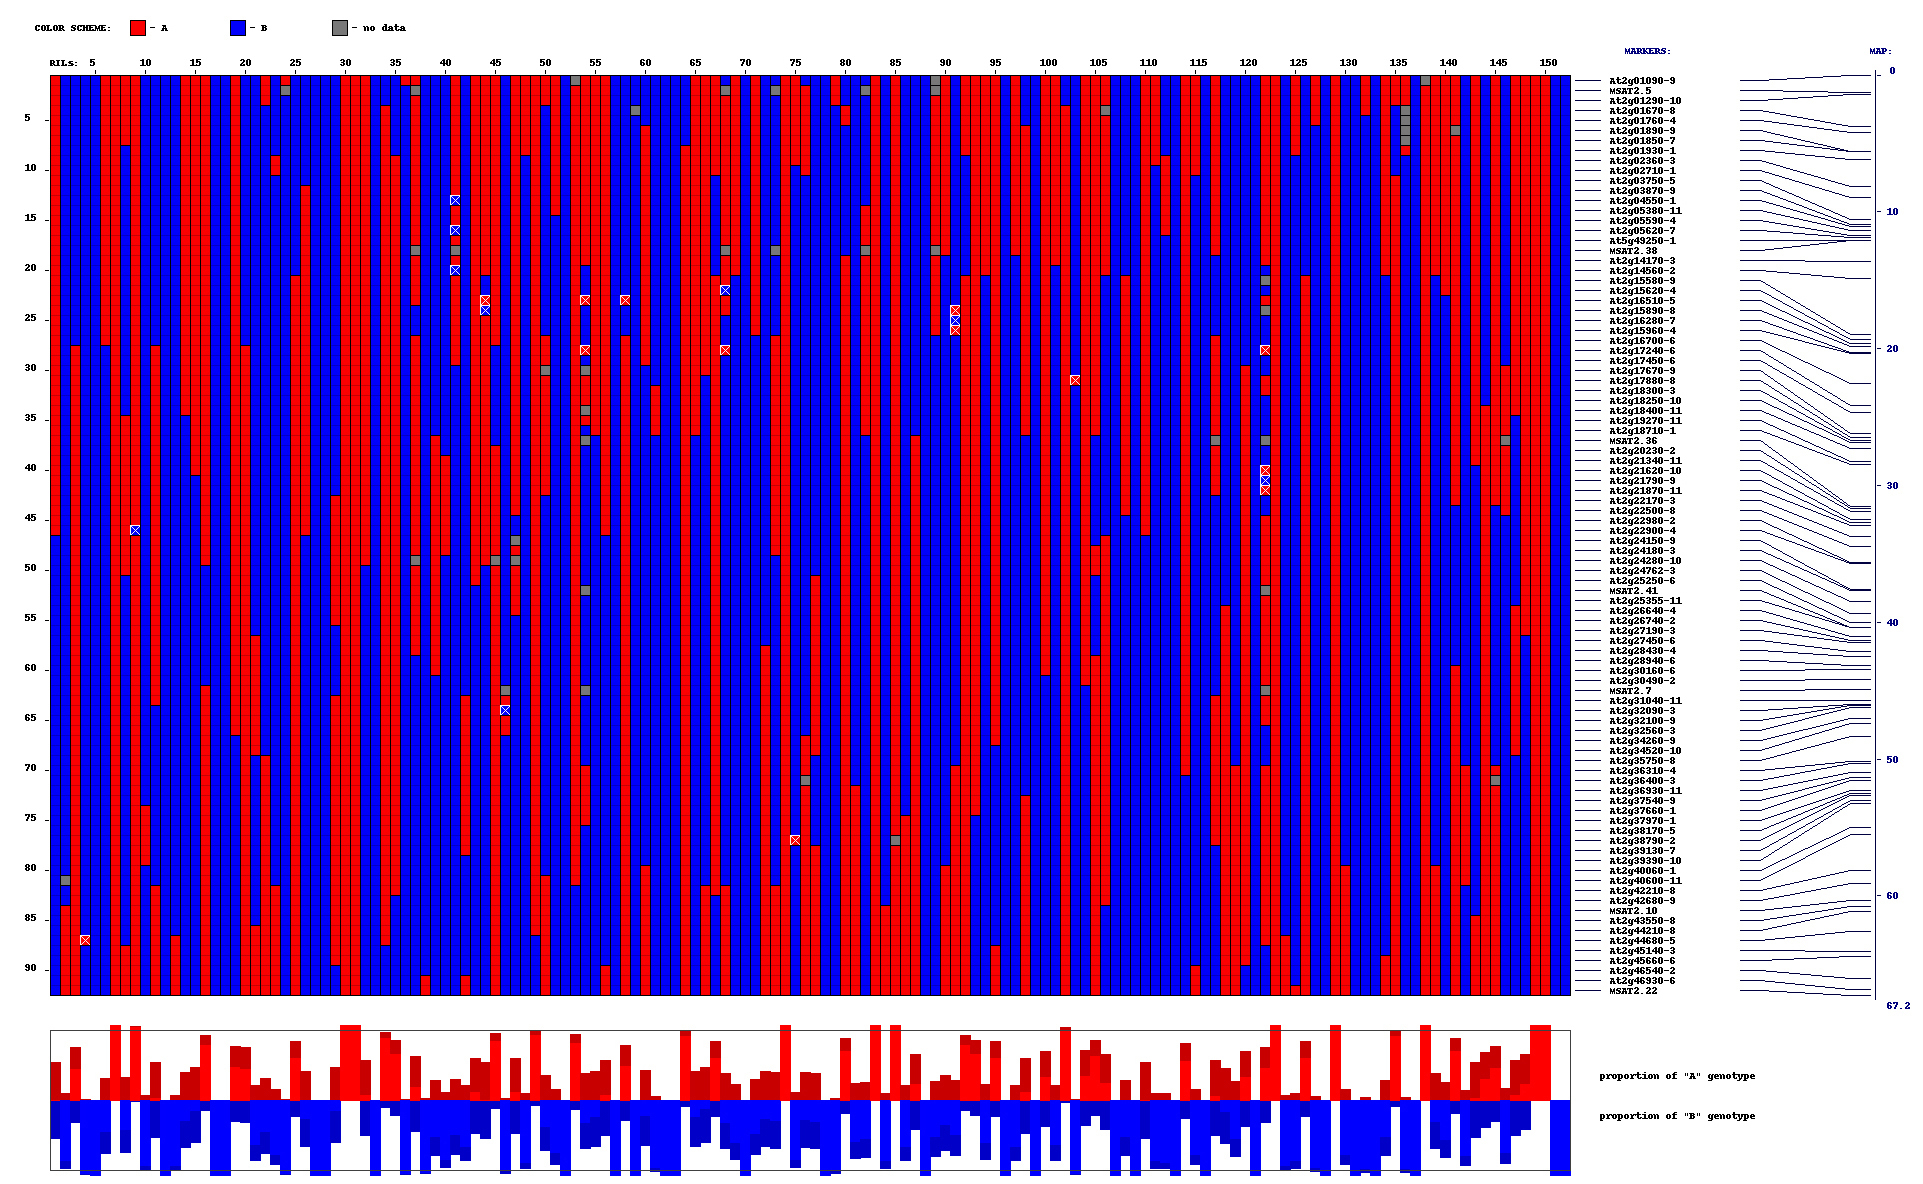 |
D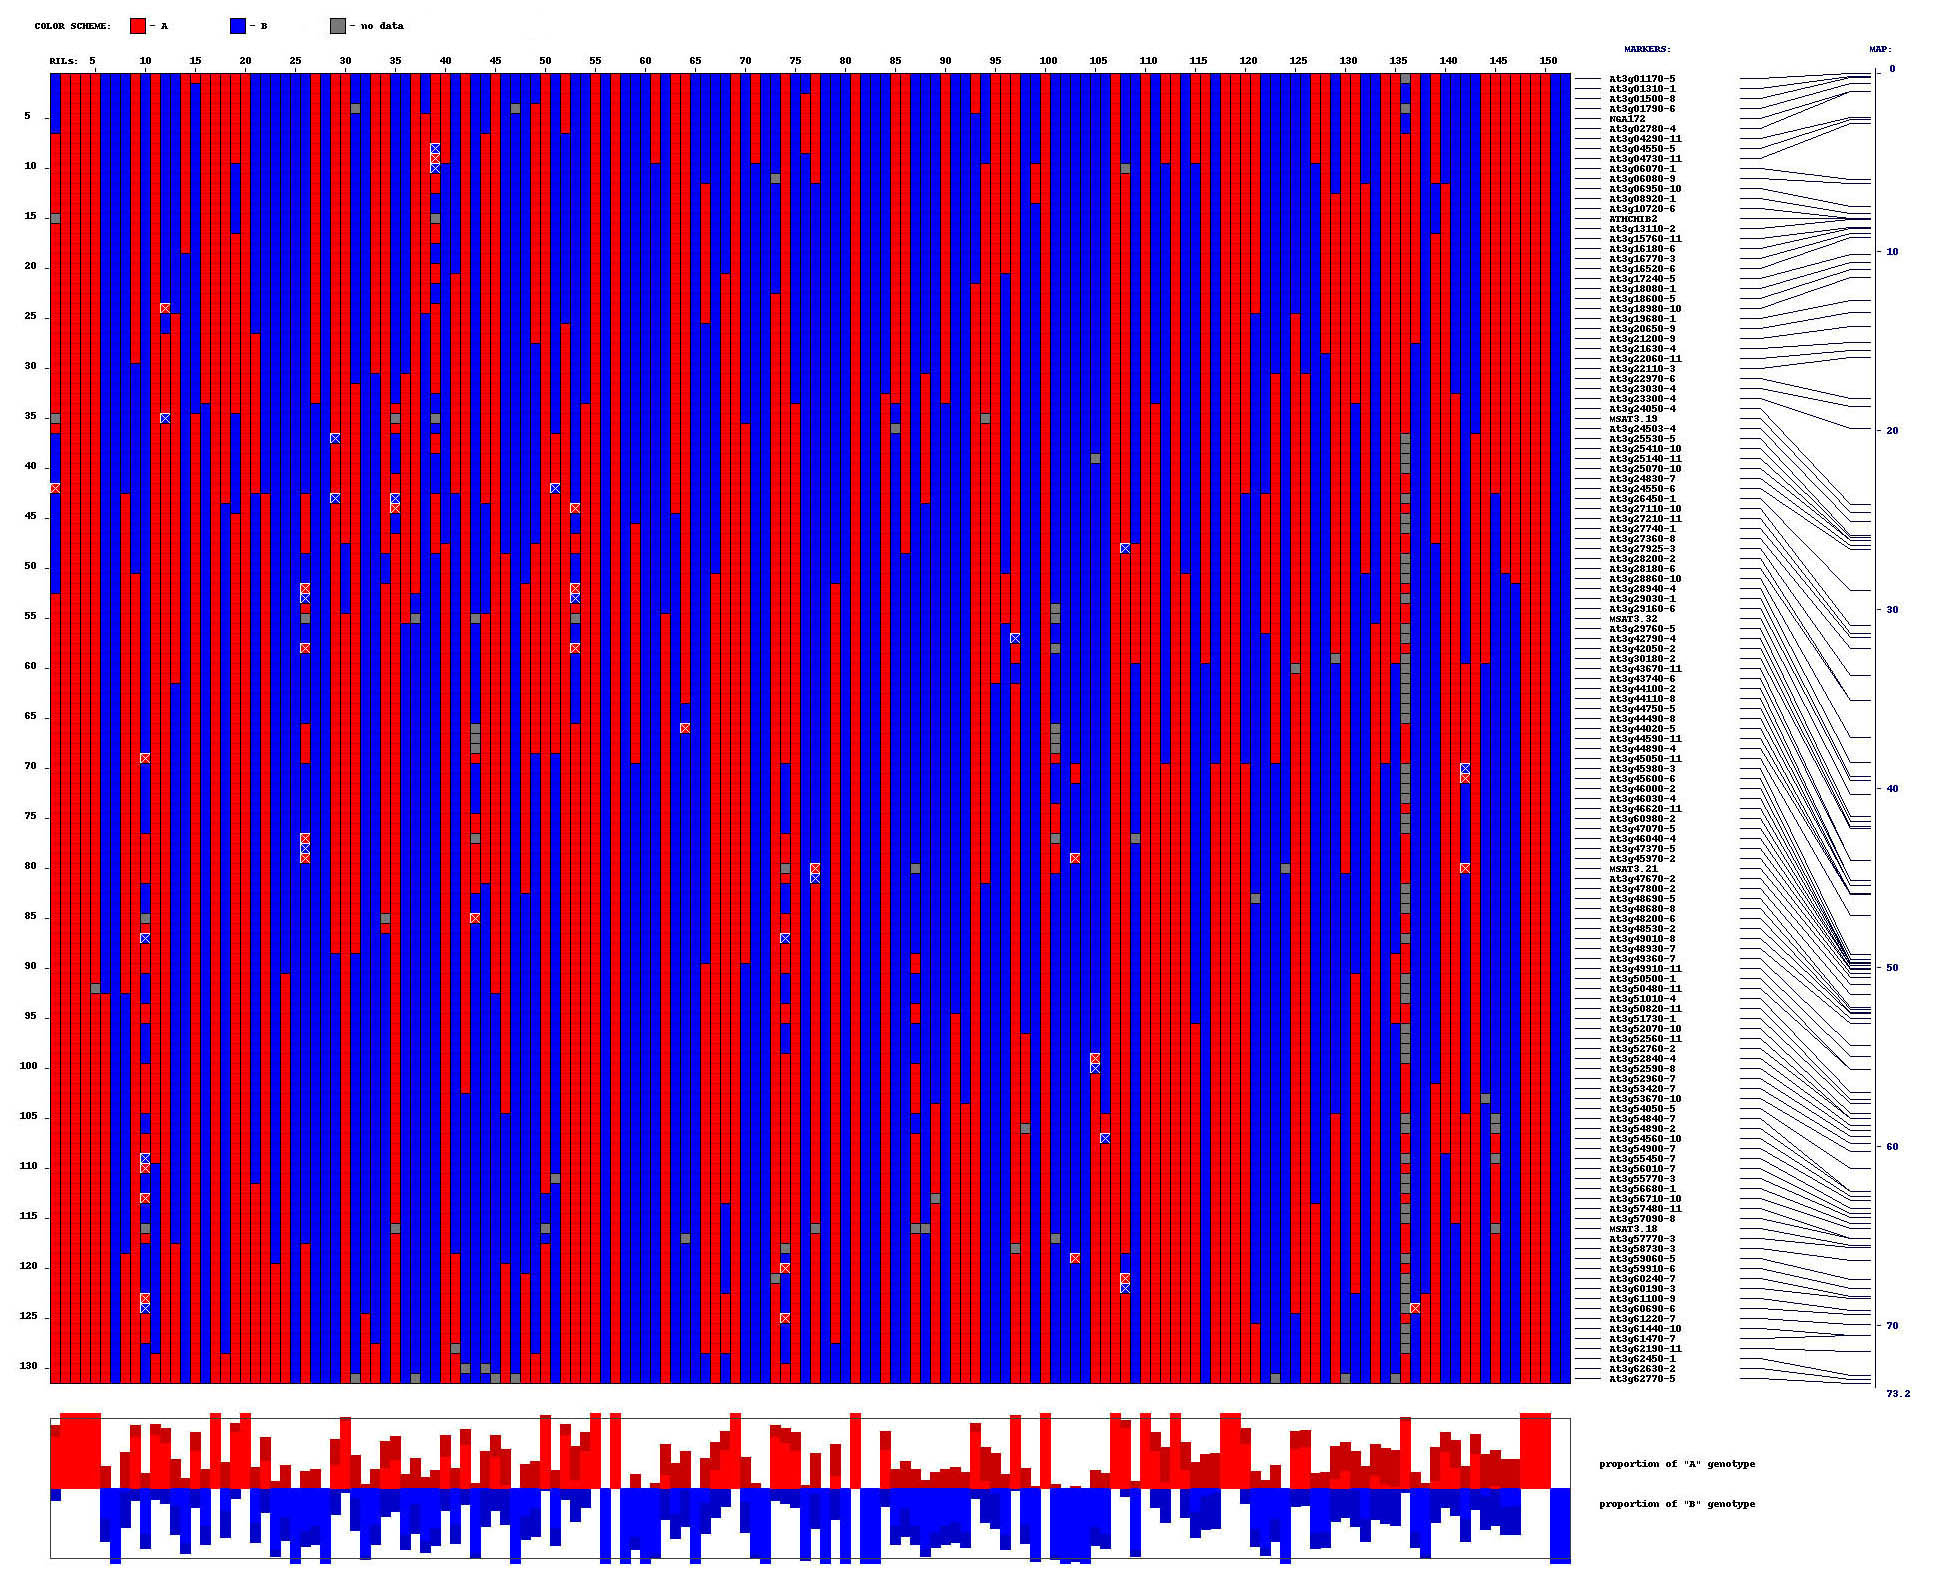 |
E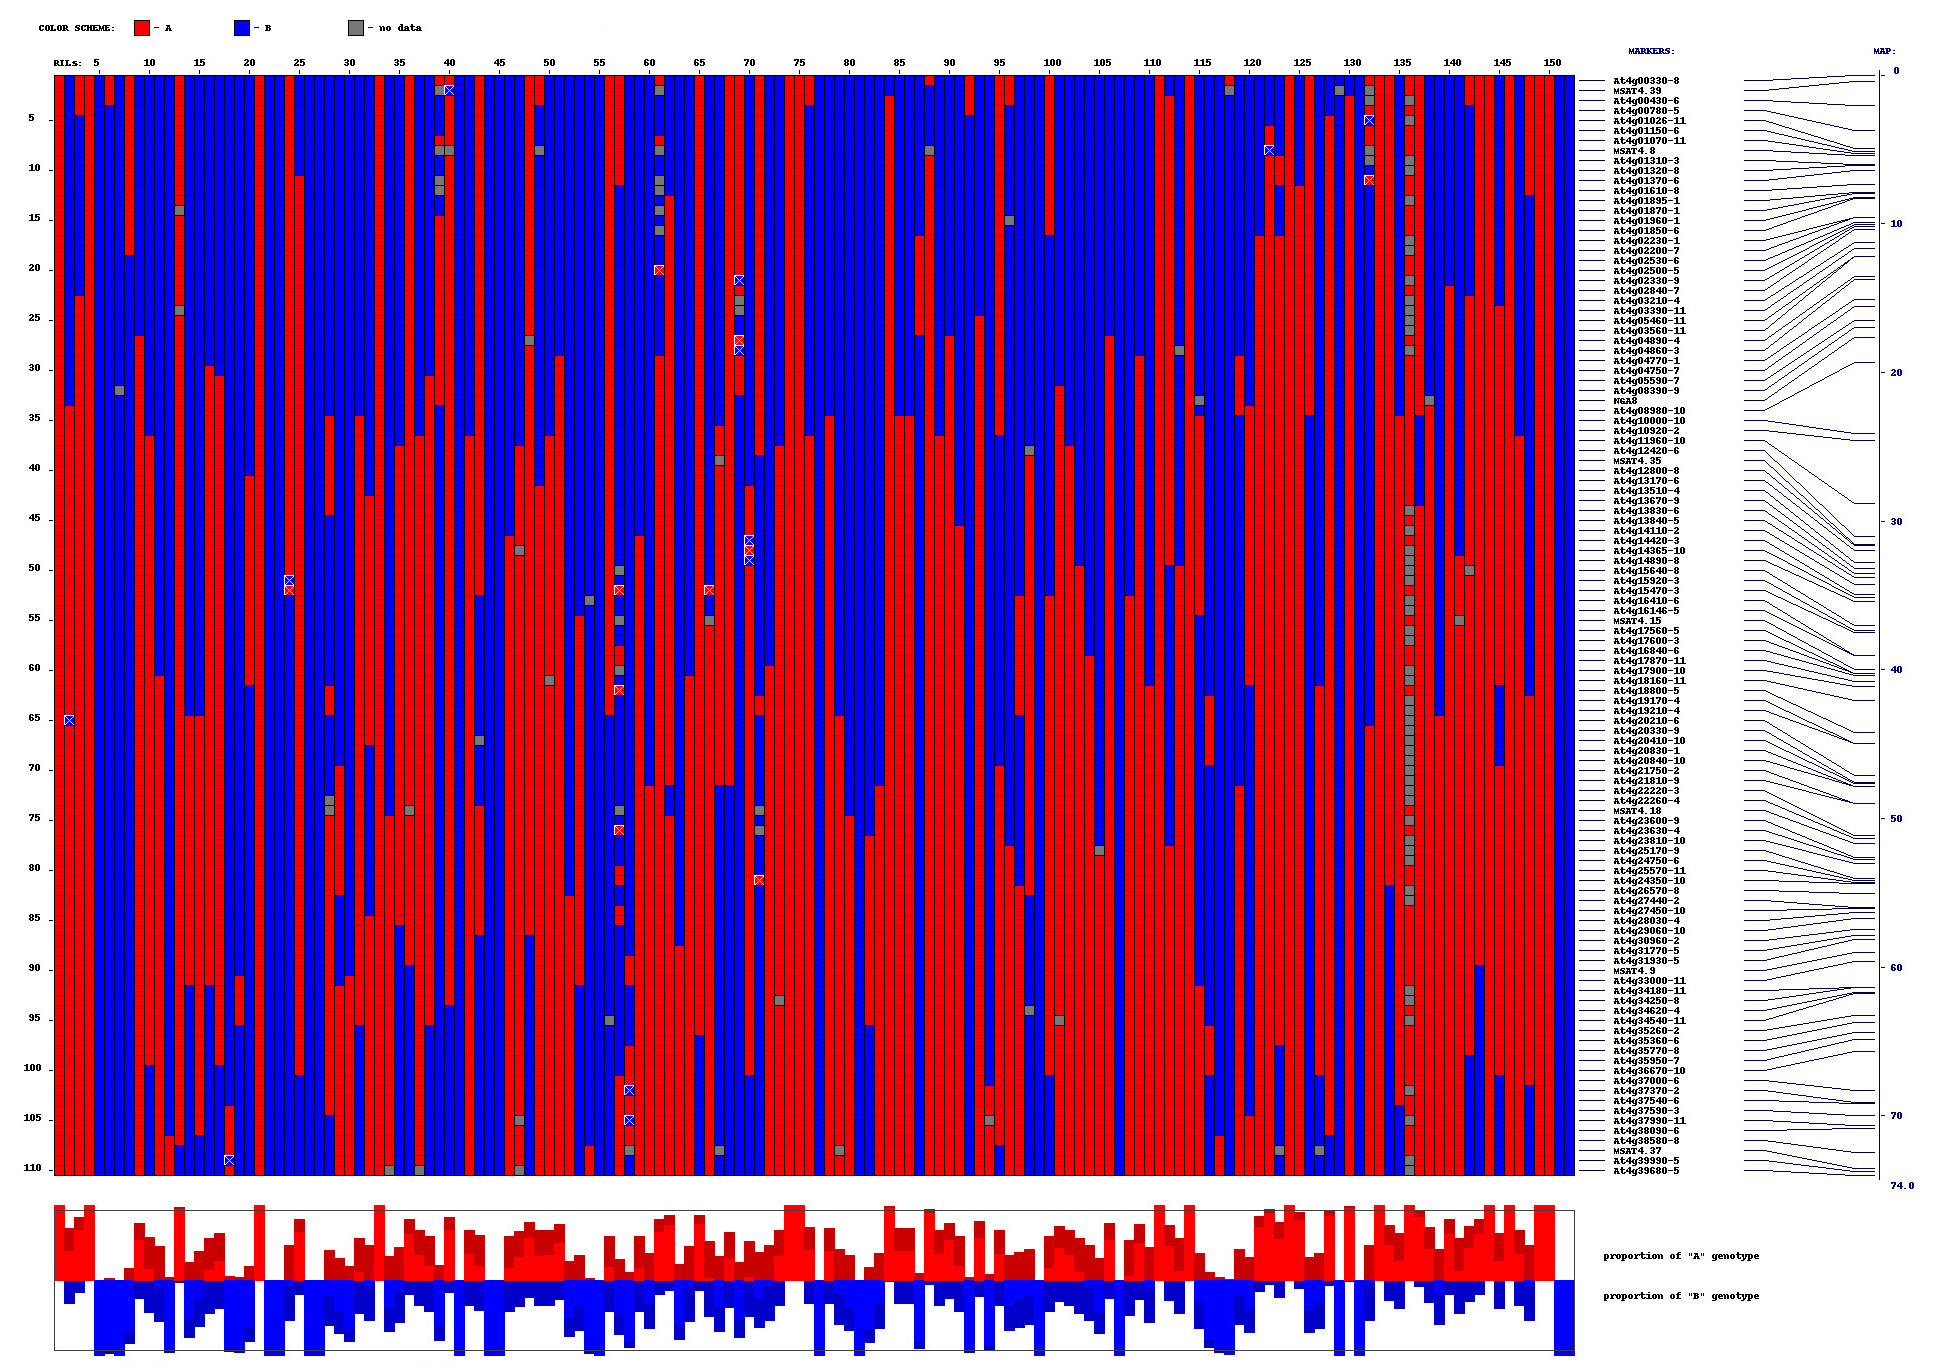 |
F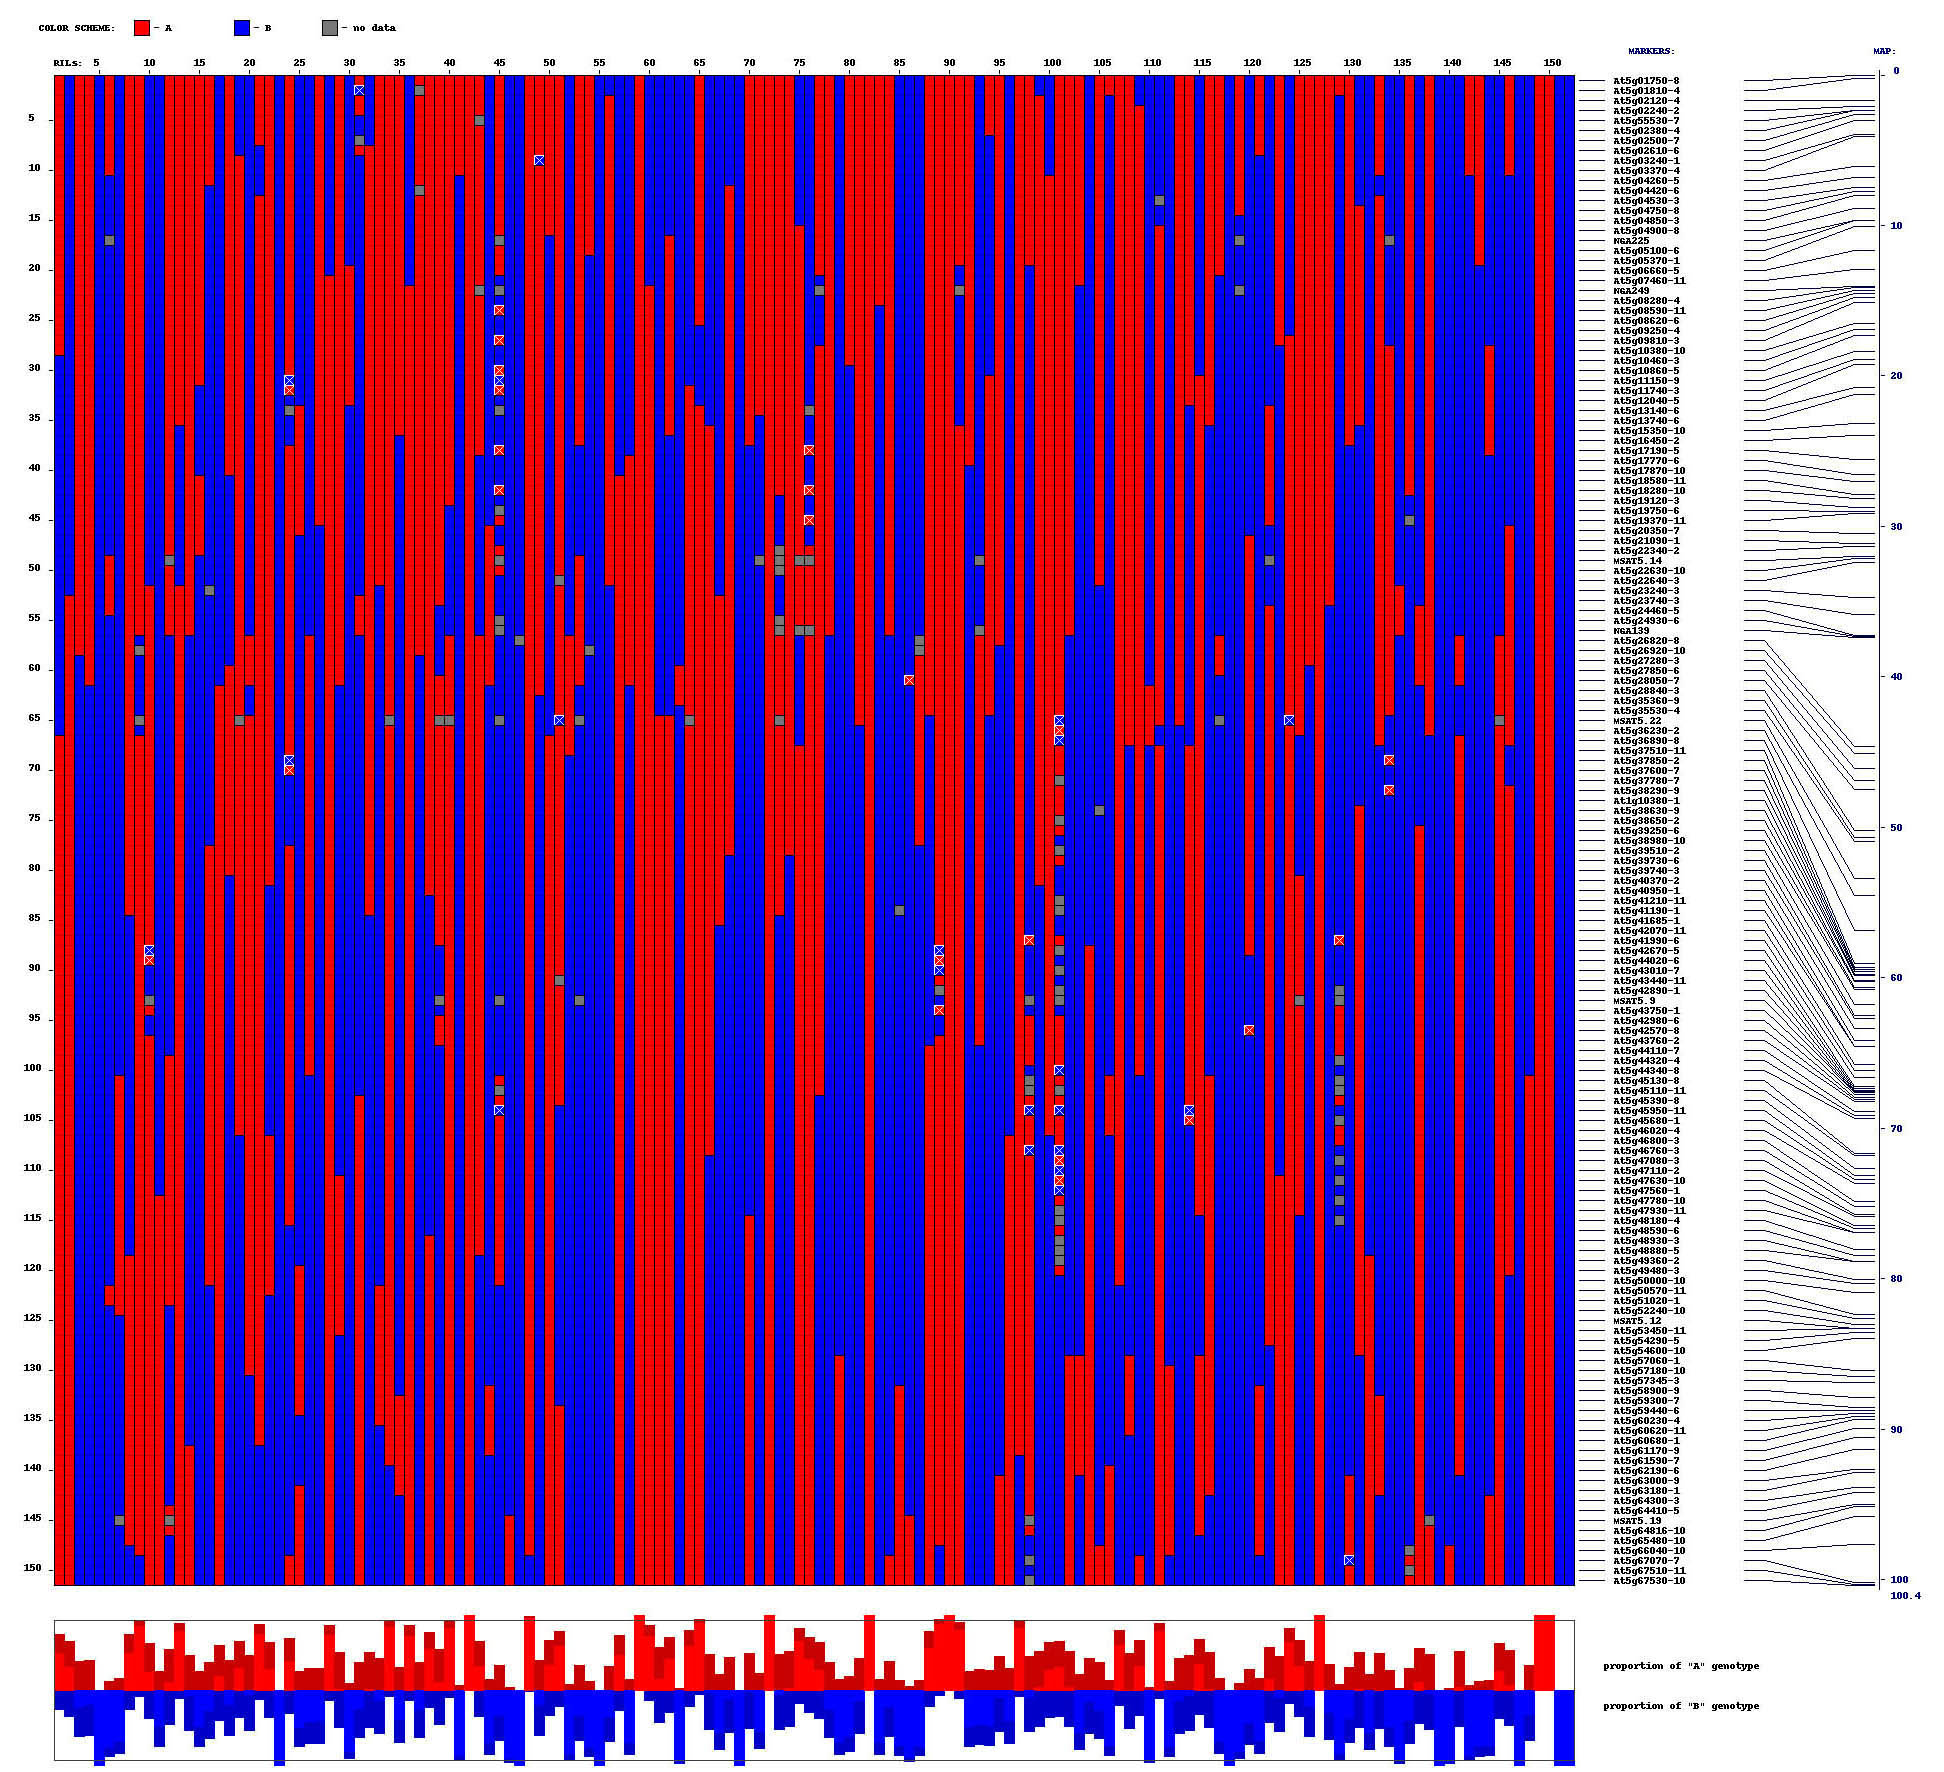 |
Supplementary Figure 6. SFP markers identified with the RIL distribution method. Haplotypes of 148 RILs plus parental genotypes.
Each column represents a RIL (first 148 columns) or parental genotype (last four columns). Rows correspond to SFP and microsatellite
markers. Red boxes indicate Sha genotypes, blue boxes indicate Bay-0 genotypes, and grey boxes indicate markers scored as
missing data. The text column (far right) lists the SFP marker IDs and the 38 microsatellite markers described in Loudet
et al.16. The final column depicts the physical distances between the markers. Below the haplotypes, the proportions of Sha (red
bars) and Bay-0 (blue bars) alleles in each RIL are depicted. A) SFP markers are arranged in physical order based on the Col-0 genomic sequence. The five Arabidopsis linkage groups are oriented
vertically, laid end-to-end. B-F) Individual linkage groups. SFP markers are ordered by their genetic distances in linkage groups 1 to 5, respectively.
This Article
-
Genome Res. June 2006 vol. 16 no. 6 787-795

