
High-density haplotyping with microarray-based expression and single feature polymorphism markers in Arabidopsis
Supplementary Figure 4, West et al.
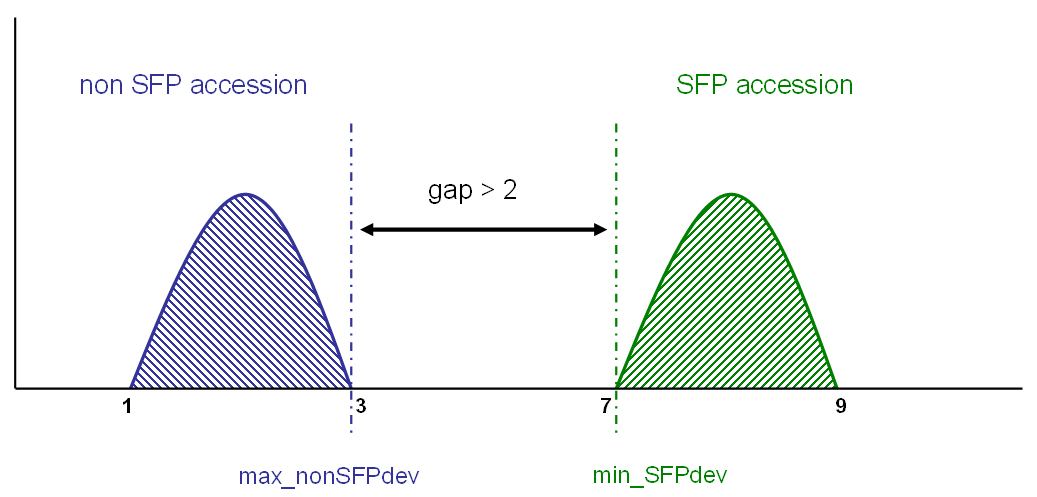
Supplementary Figure 4. Parental SFPdev distributions for a hypothetical SFP marker. SFPdev values are plotted on the x-axis, while frequency is indicated on the y-axis. The gap value indicates the degree of overlap (or distance) between parental SFPdev distributions. The max_nonSFPdev and min_SFPdev values were used to assign a genotype to the 148 RILs.
This Article
-
Genome Res. June 2006 vol. 16 no. 6 787-795

