
High-density haplotyping with microarray-based expression and single feature polymorphism markers in Arabidopsis
Supplementary Figure 1, West et al.
Click on the images to open a new window with a larger high-resolution image.
A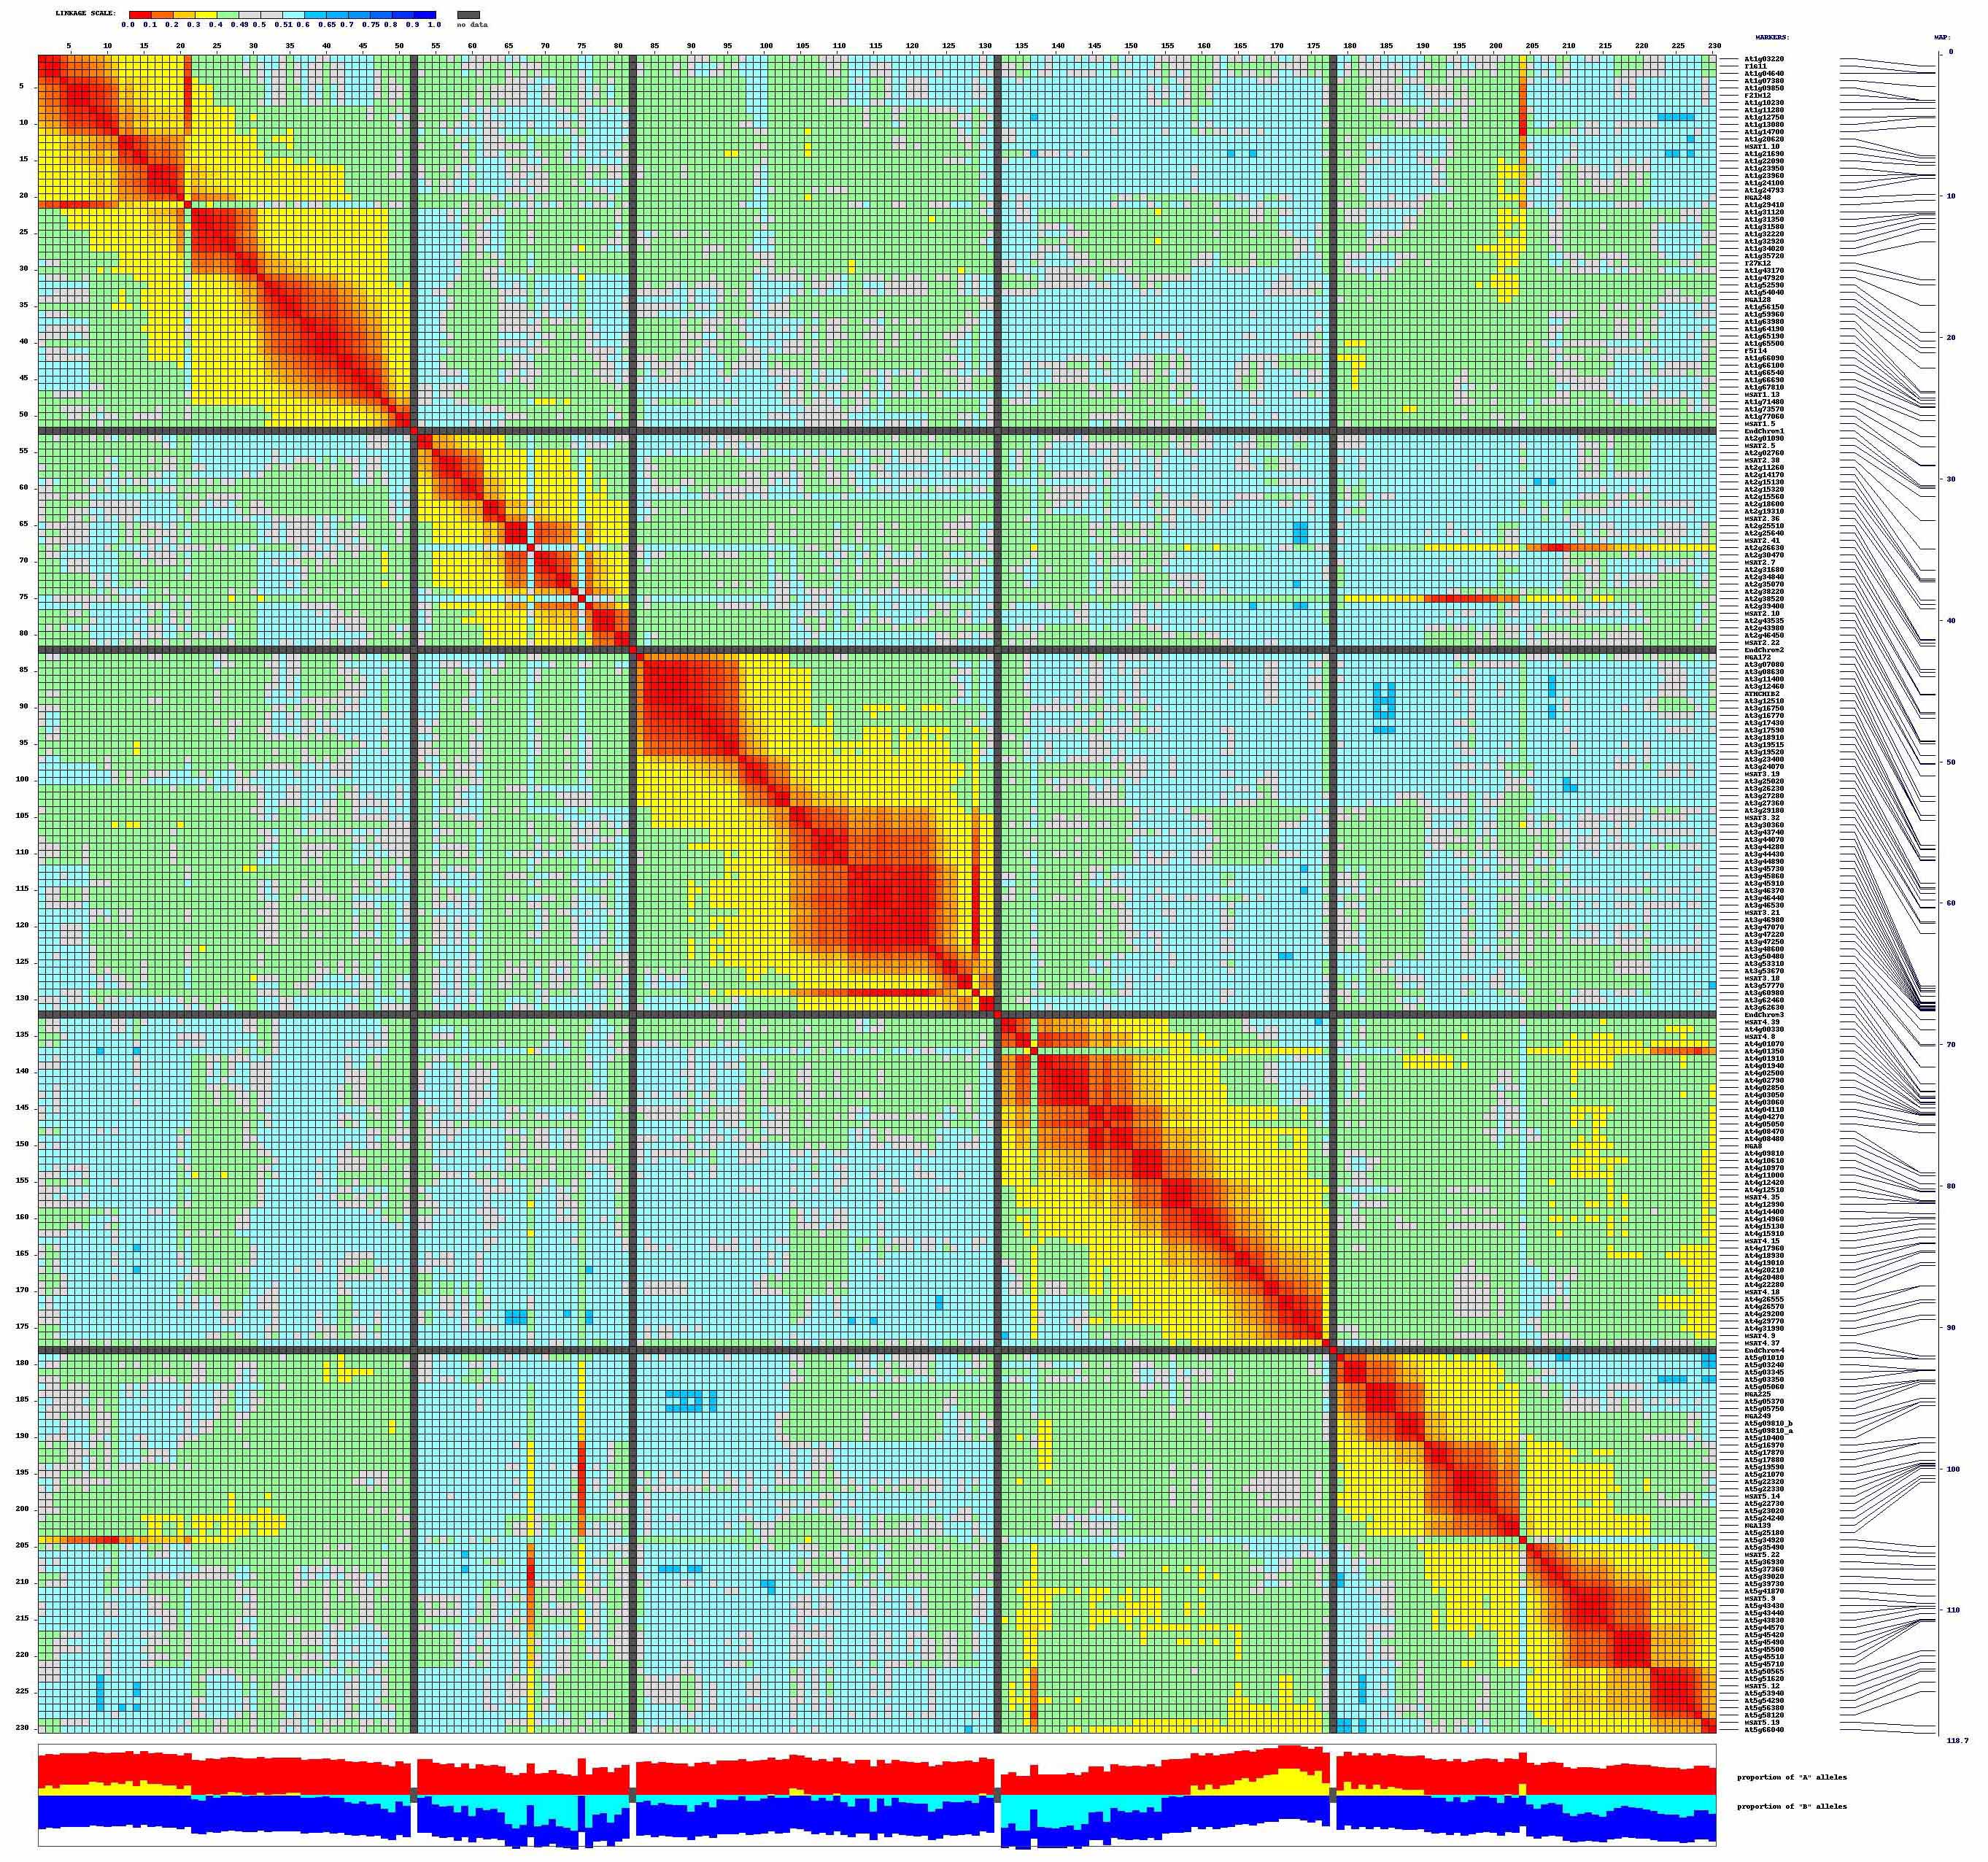 |
B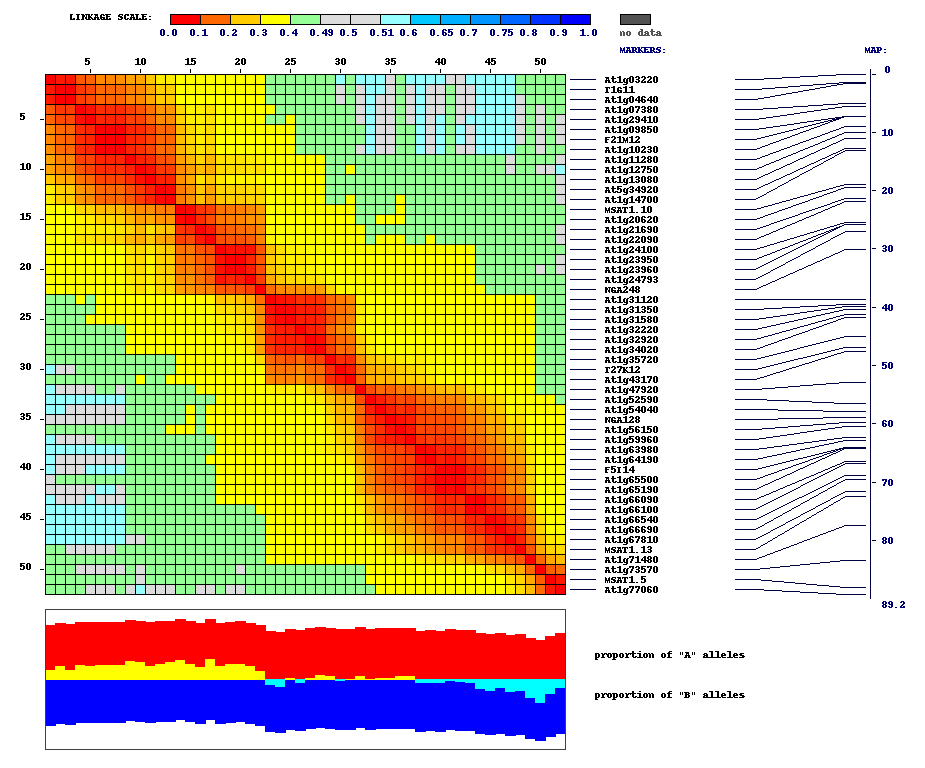 |
C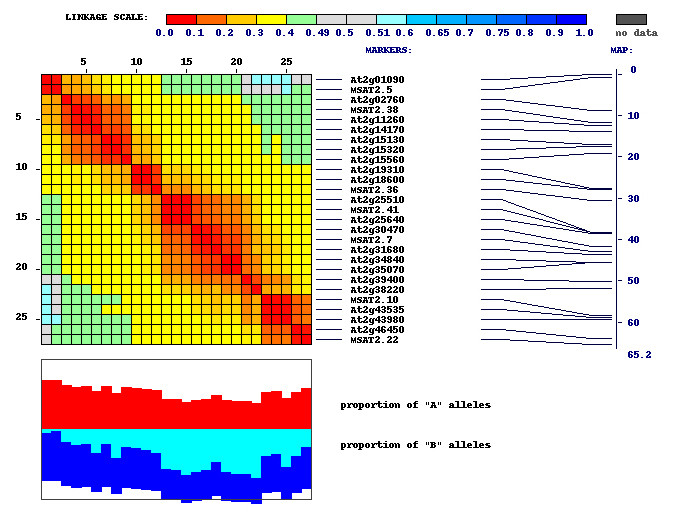 |
D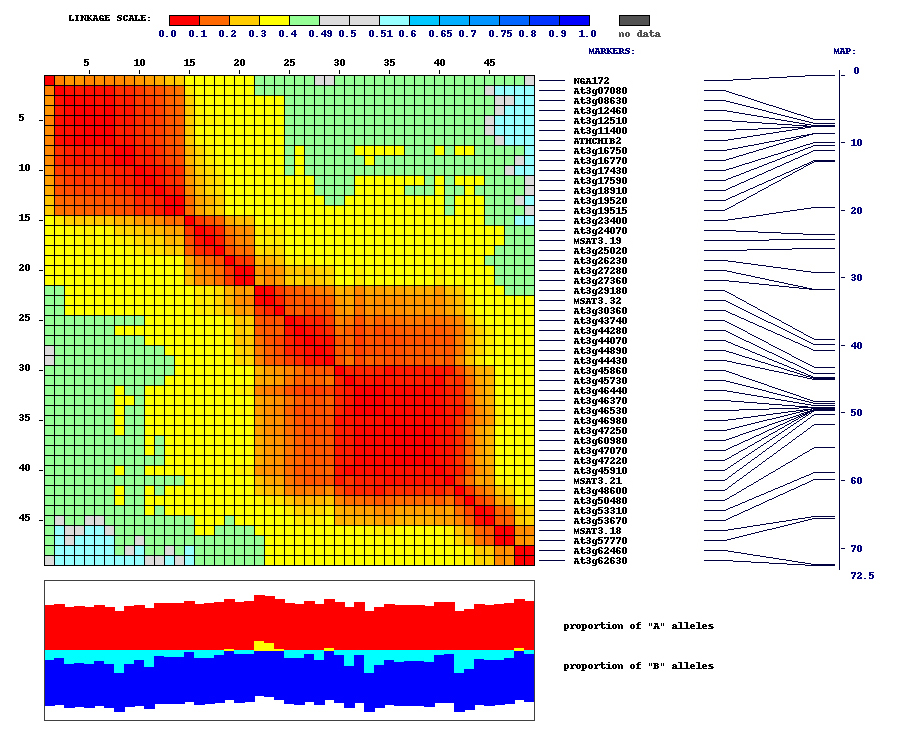 |
E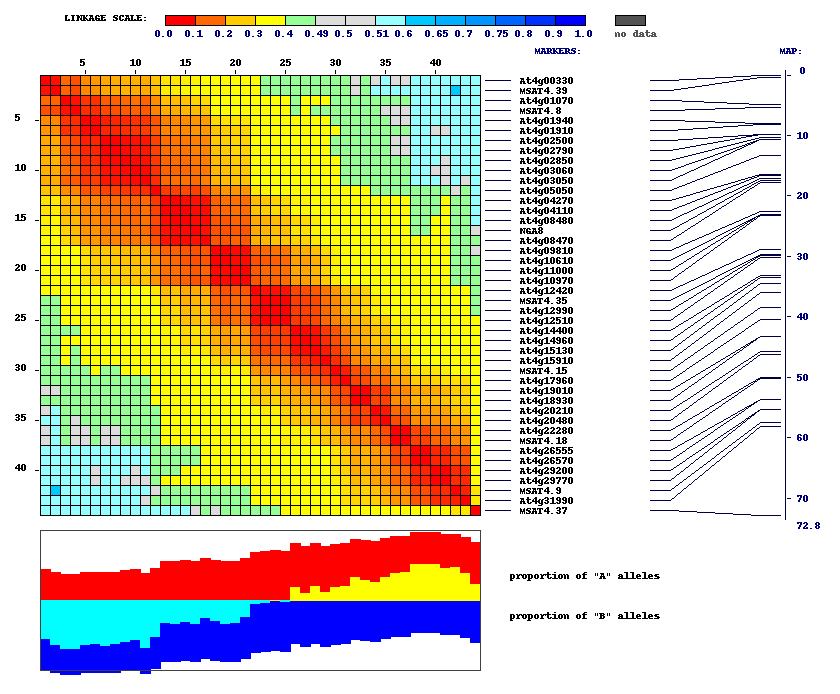 |
F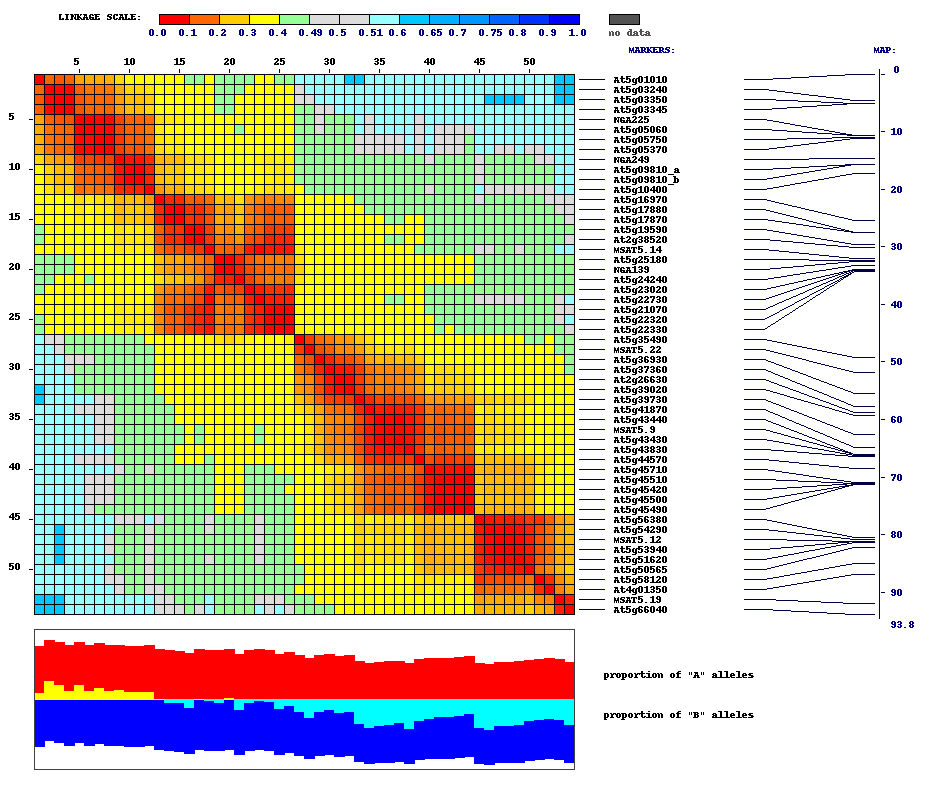 |
Supplementary Figure 1. GEMs identified with the parental min-max method. Heat map showing a matrix of recombination scores for GEMs and microsatellite
markers assayed on 148 RILs. Pair-wise comparisons between markers were used to assign recombination scores, which are plotted
as a heat map matrix of all markers (top to bottom) against all markers (left to right). Lowest recombination scores, suggesting
marker linkage, are indicated by red boxes, while blue boxes indicate high recombination scores, suggesting no linkage. Segregation
ratios for alleles at each marker are depicted below the heat map, with red representing Sha alleles and blue representing
Bay-0 alleles. A) All 5 linkage groups. GEMs are ordered by their physical location in the Col-0 genomic sequence. B-F) Individual linkage groups. GEMs are ordered by their genetic distances in linkage groups 1 to 5, respectively.
This Article
-
Genome Res. June 2006 vol. 16 no. 6 787-795

