
Figure 5.
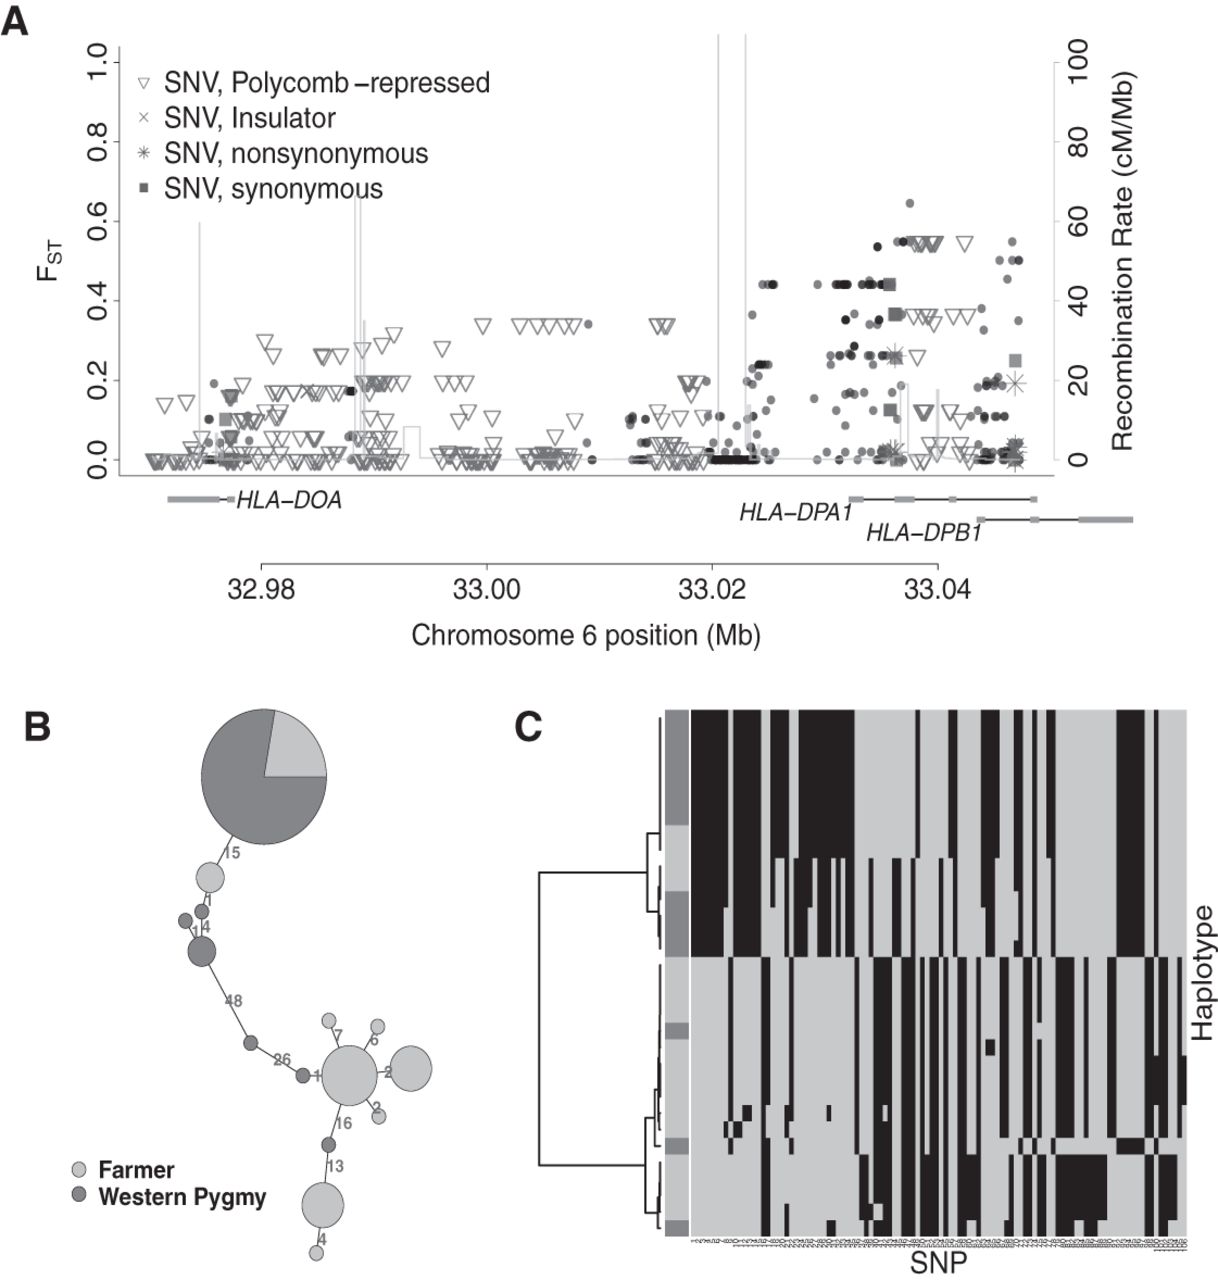
Candidate selection signal near HLA-DPA1. (A) As in Figure 3, but for the candidate locus Chr 6: 32968692–33049012. (B,C) As in Figure 3, but for the region Chr 6: 33.03–33.05 Mb with elevated FST.
(Downloading may take up to 30 seconds. If the slide opens in your browser, select File -> Save As to save it.)
Click on image to view larger version.
Candidate selection signal near HLA-DPA1. (A) As in Figure 3, but for the candidate locus Chr 6: 32968692–33049012. (B,C) As in Figure 3, but for the region Chr 6: 33.03–33.05 Mb with elevated FST.
 CiteULike
 Delicious
 Digg
Digg Facebook
 Google+
 Reddit
 Twitter
