
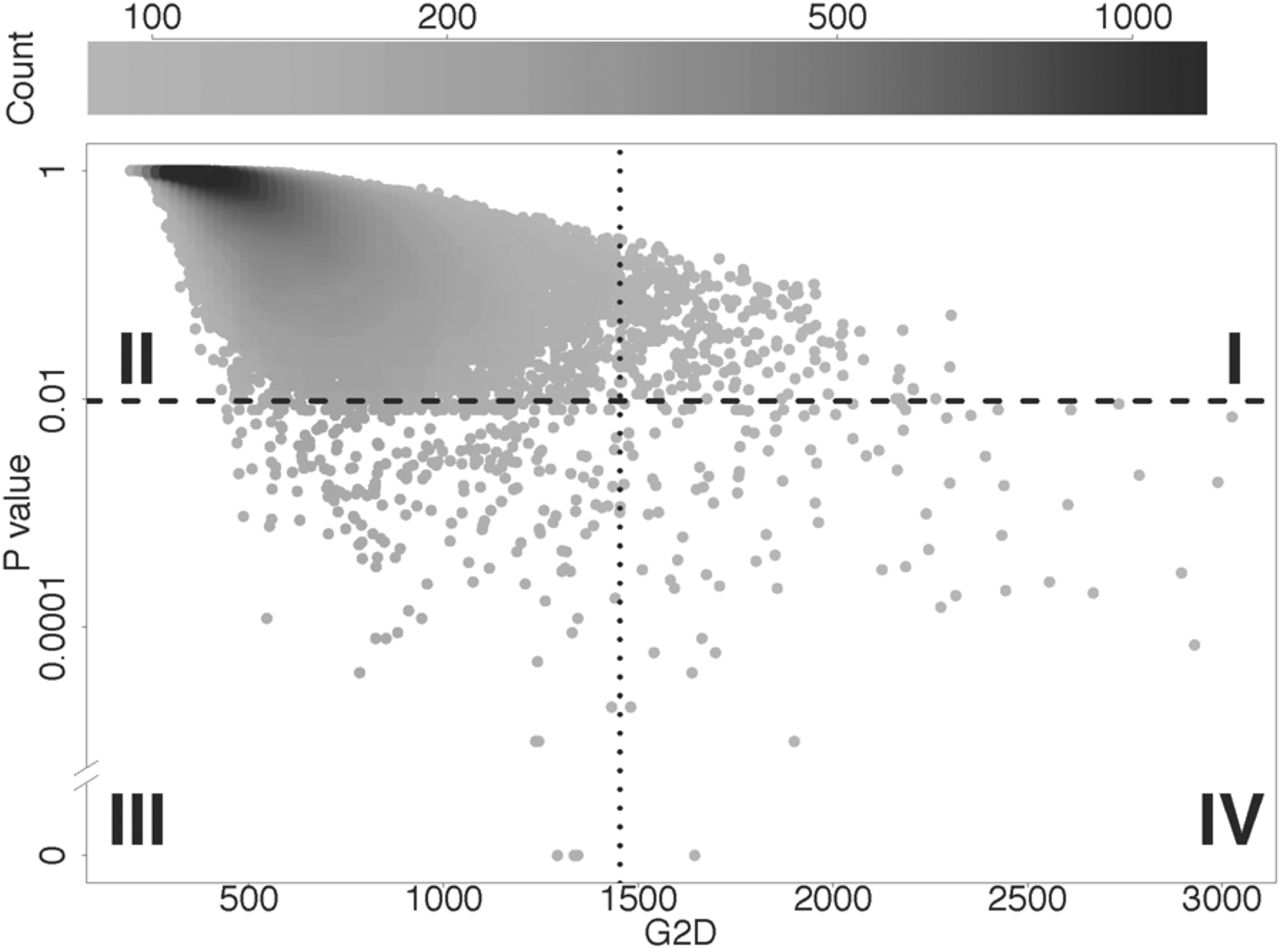
Figure 2.
Importance of using P-values to define candidates in the G2D analysis. Each point is a window of 500 single-nucleotide variants, and shading represents the density of points. The vertical dotted line and the horizontal dashed line are the top 0.5% significance cutoffs for the G2D and P-value distributions, respectively. Windows in Quadrant I are outliers in the G2D distribution but are not statistically significant when the effects of demography and genome architecture are controlled for. In Quadrant III are the many windows that are statistically significant even though their G2D values are modest.


