
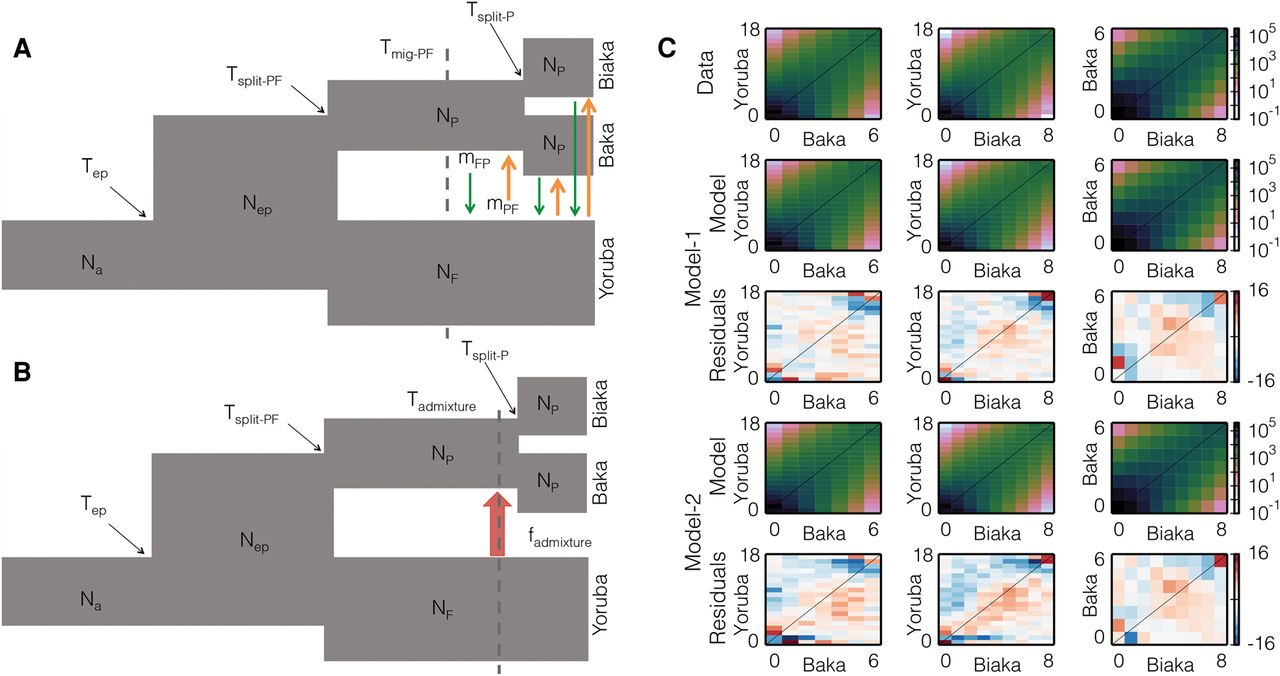
Figure 1.
Best-fit demographic models and observed and predicted frequency spectra for African farmer (Yoruba) and Pygmy (Baka and Biaka) populations. (A) The continuous asymmetric gene flow model (Model-1) with the 10 free parameters labeled. (B) The single-pulse admixture model (Model-2) with the nine free parameters labeled. (C) The marginal spectra for each pair of populations. Row one is data, rows two (Model-1) and four (Model-2) are models, and rows three and five are Anscombe residuals of model minus data for Model-1 and Model-2, respectively.


