
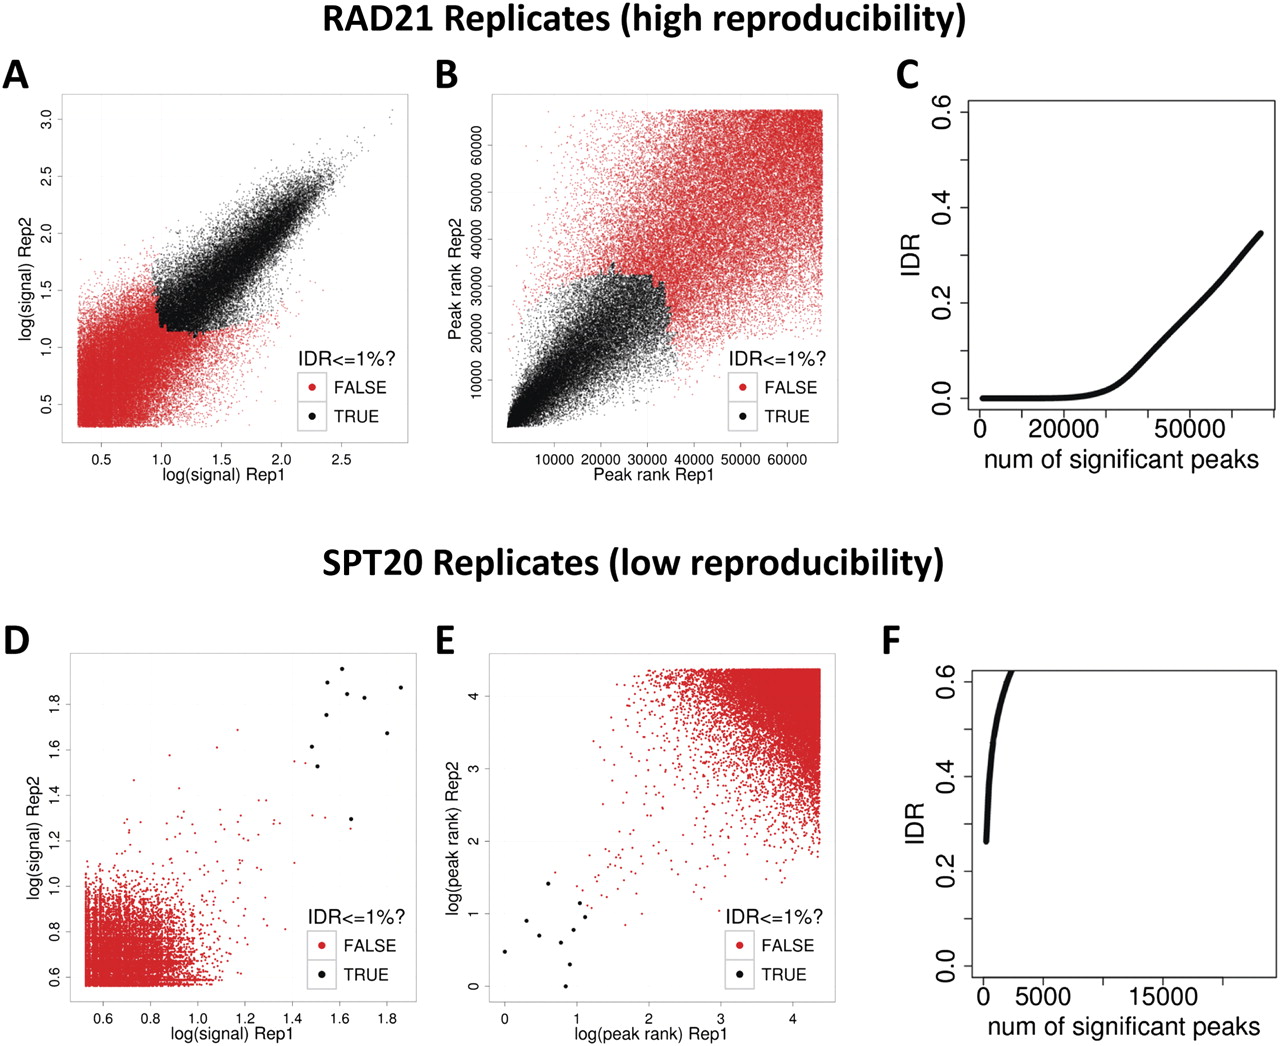
The irreproducible discovery rate (IDR) framework for assessing reproducibility of ChIP-seq data sets. (A–C) Reproducibility analysis for a pair of high-quality RAD21 ChIP-seq replicates. (D,E) The same analysis for a pair of low quality SPT20 ChIP-seq replicates. (A,D) Scatter plots of signal scores of peaks that overlap in each pair of replicates. (B,E) Scatter plots of ranks of peaks that overlap in each pair of replicates. Note that low ranks correspond to high signal and vice versa. (C,F) The estimated IDR as a function of different rank thresholds. (A,B,D,E) Black data points represent pairs of peaks that pass an IDR threshold of 1%, whereas the red data points represent pairs of peaks that do not pass the IDR threshold of 1%. The RAD21 replicates show high reproducibility with ∼30,000 peaks passing an IDR threshold of 1%, whereas the SPT20 replicates show poor reproducibility with only six peaks passing the 1% IDR threshold.


