
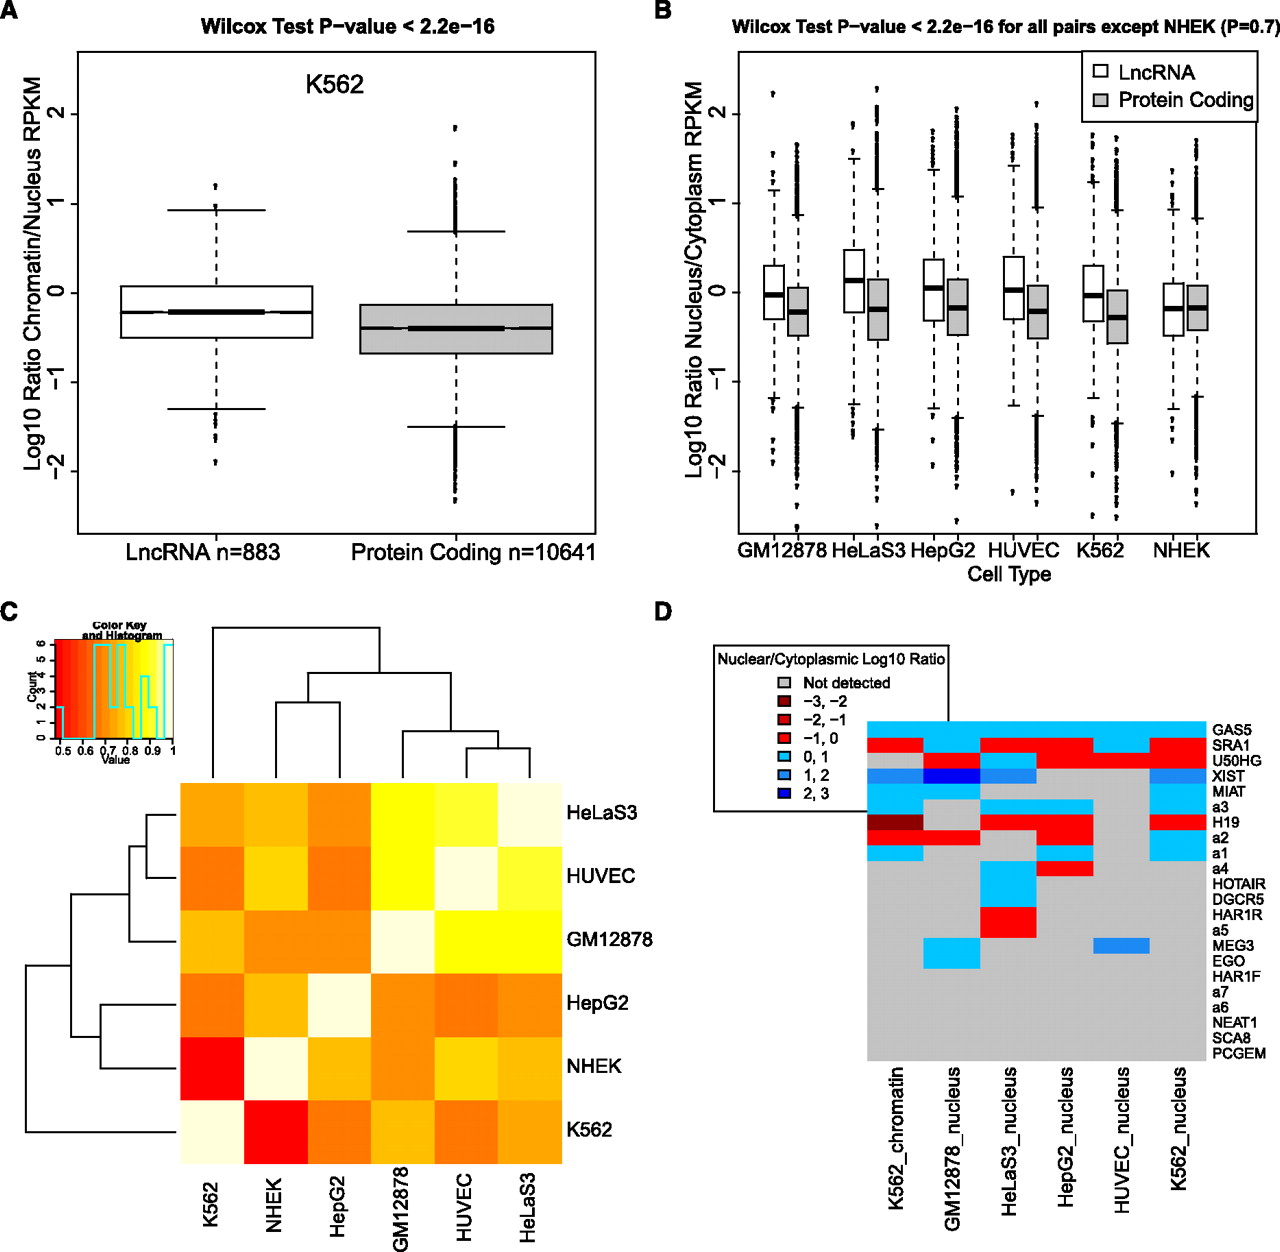
LncRNAs are enriched in the cell nucleus and chromatin. (A) Shown are the chromatin/cytoplasm expression ratios of lncRNAs and protein-coding transcripts in K562 cells. Data are represented as log10-transformed ratios of RPKM values (log10[chromatin RPKM/cytoplasm RPKM]). The data correspond to the 310 lncRNA and 10,287 protein-coding transcripts that fall below a 0.1 IDR threshold in both nuclear and chromatin data. (B) The boxplot, similar to that in A, shows the nucleus/cytoplasm expression ratios for the six ENCODE cell lines where data is available. Between 290 and 758 lncRNAs passed IDR cutoff and are shown, compared with between 16,561 and 20,666 protein-coding transcripts. (C) Nuclear enrichment of lncRNAs is correlated between cell types. The heatmap shows pairwise Pearson correlation values for the set of 98 lncRNA transcripts that passed IDR cutoff in all six ENCODE cell lines. Correlation was calculated for the nuclear/cytoplasmic enrichment value for this set of transcripts between each pair of cells. (D) Subcellular localization of known lncRNAs. The set of known lncRNAs was manually curated from the literature and lncRNAdb database (Amaral et al. 2011). (Not detected) The RPKM values did not meet the IDR 0.1 threshold.


