
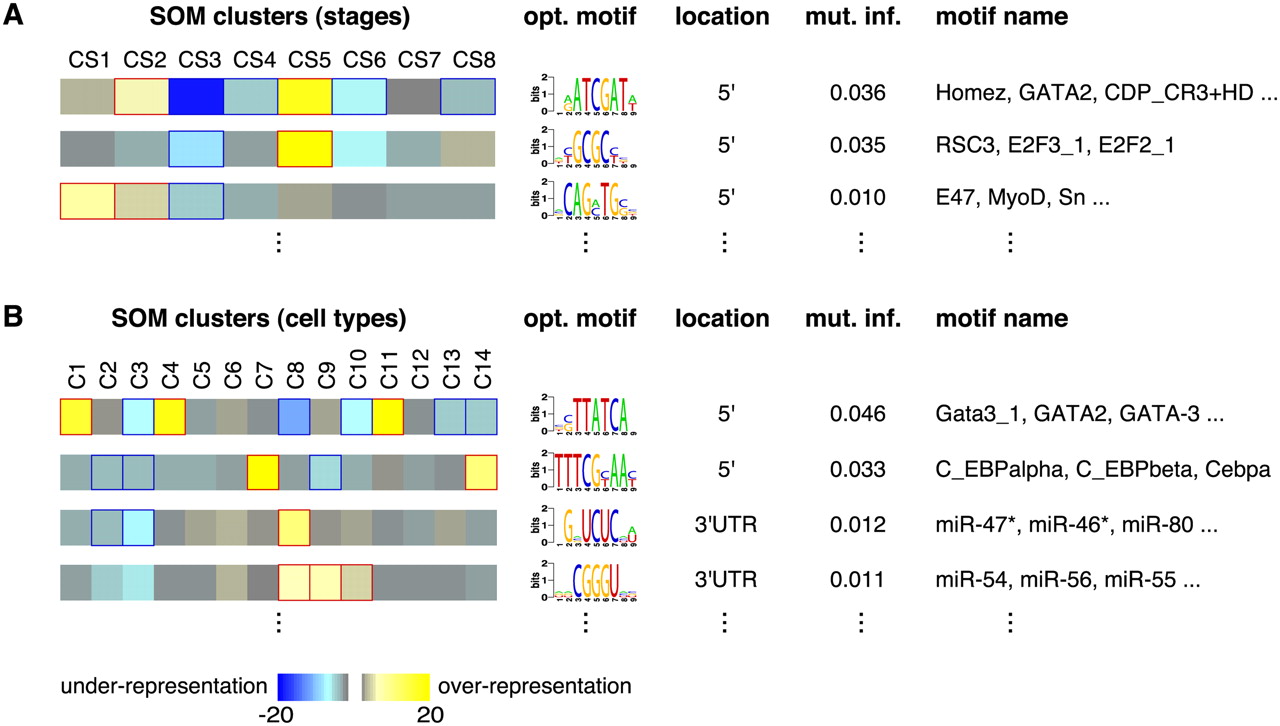
Selected regulatory elements discovered in stage and cell-type expression clusters. FIRE analysis identifies motifs over- and underrepresented in developmental profile clusters (A) and cell-type profile clusters (B). Complete results are shown in Supplemental Figure S23. A heat map indicates whether each motif is overrepresented (yellow) or underrepresented (blue) in each cluster. Motifs are arranged in rows and clusters in columns. Significant overrepresentation is indicated by red box outlines and underrepresentation is indicated by blue outlines (P ≤ 0.05, Bonferroni-corrected). The optimized motif logo, location of the motif (5′ upstream promoter or 3′ UTR), mutual information with the genes in the cluster, and matching transcription factors and miRNAs listed in public data bases for indicated motifs are shown alongside the heat map.


