
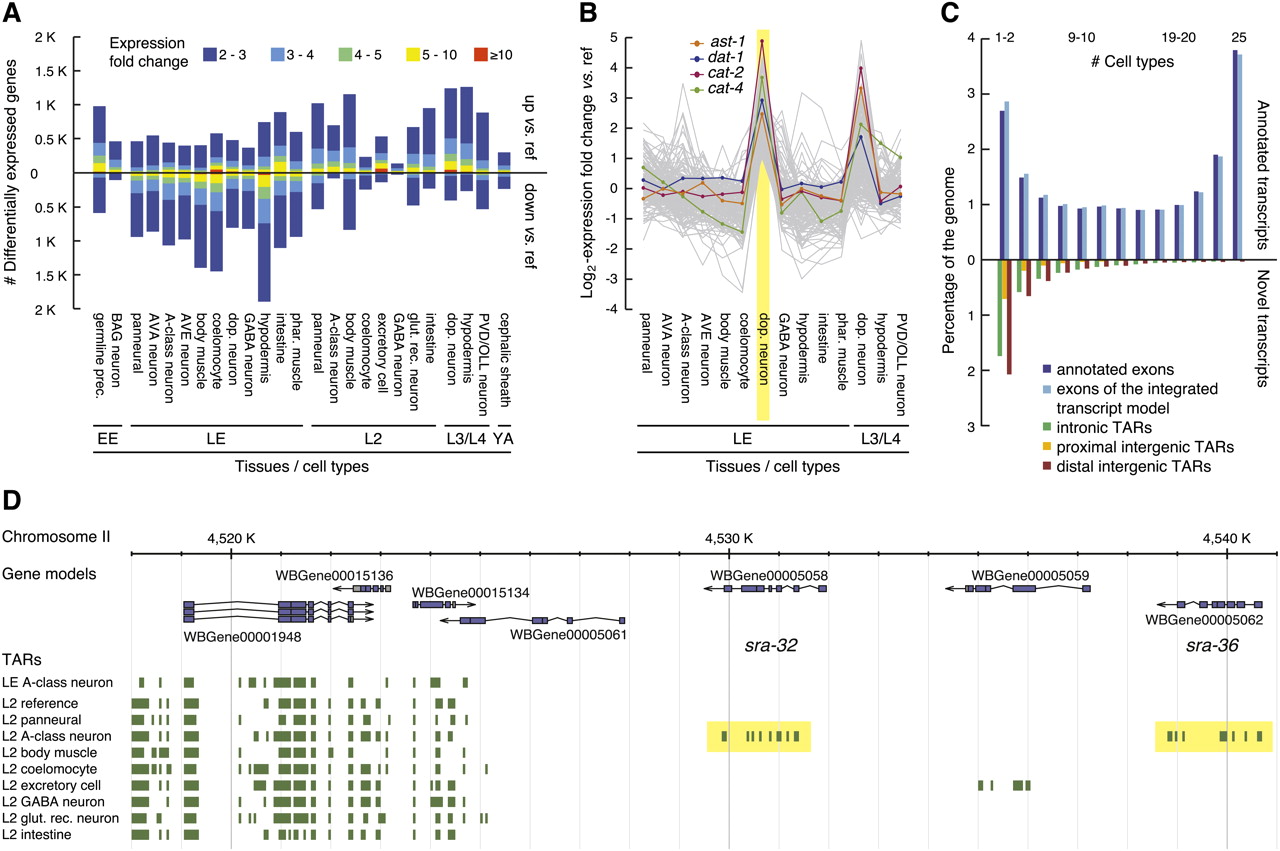
Transcripts enriched or depleted in certain cell types. (A) Genes differentially expressed between a given cell type and the corresponding reference sample (FDR ≤0.05). Bars pointing up and down indicate the number of enriched and depleted genes, respectively, relative to reference. Expression fold change is color-coded (see key). (B) Log2-expression fold change relative to reference shown as gray lines for genes selectively enriched in LE dopaminergic neurons (highlighted in yellow). Four selectively enriched genes (ast-1, dat-1, cat-2, cat-4) with known function in these neurons are plotted in color (see key). (C) Coverage of the genome by expressed transcripts at base-pair resolution. Nucleotides in nonredundant TARs (nrTARs) (for 25 cell-type samples) (Table 1) were binned according to the number of samples for which a TAR was detected at the given position. Bars pointing upward correspond to expressed TARs overlapping with exons of annotated coding genes and those defined by the integrated transcript model. Bars pointing downward correspond to nucleotides in expressed novel TARs (for definition, see main text) organized into subgroups according to their location relative to annotated protein coding gene models (see key). Intergenic positions were classified as proximal if within 500 bp of any annotated gene and otherwise as distal. (D) 7TM genes are selectively expressed in a specific neuron. Two members (sra-32 and sra-36) of a tandem array (yellow highlights) of 7TM-encoding genes are selectively enriched in the A-type motor neuron data set derived from L2 larvae.


