
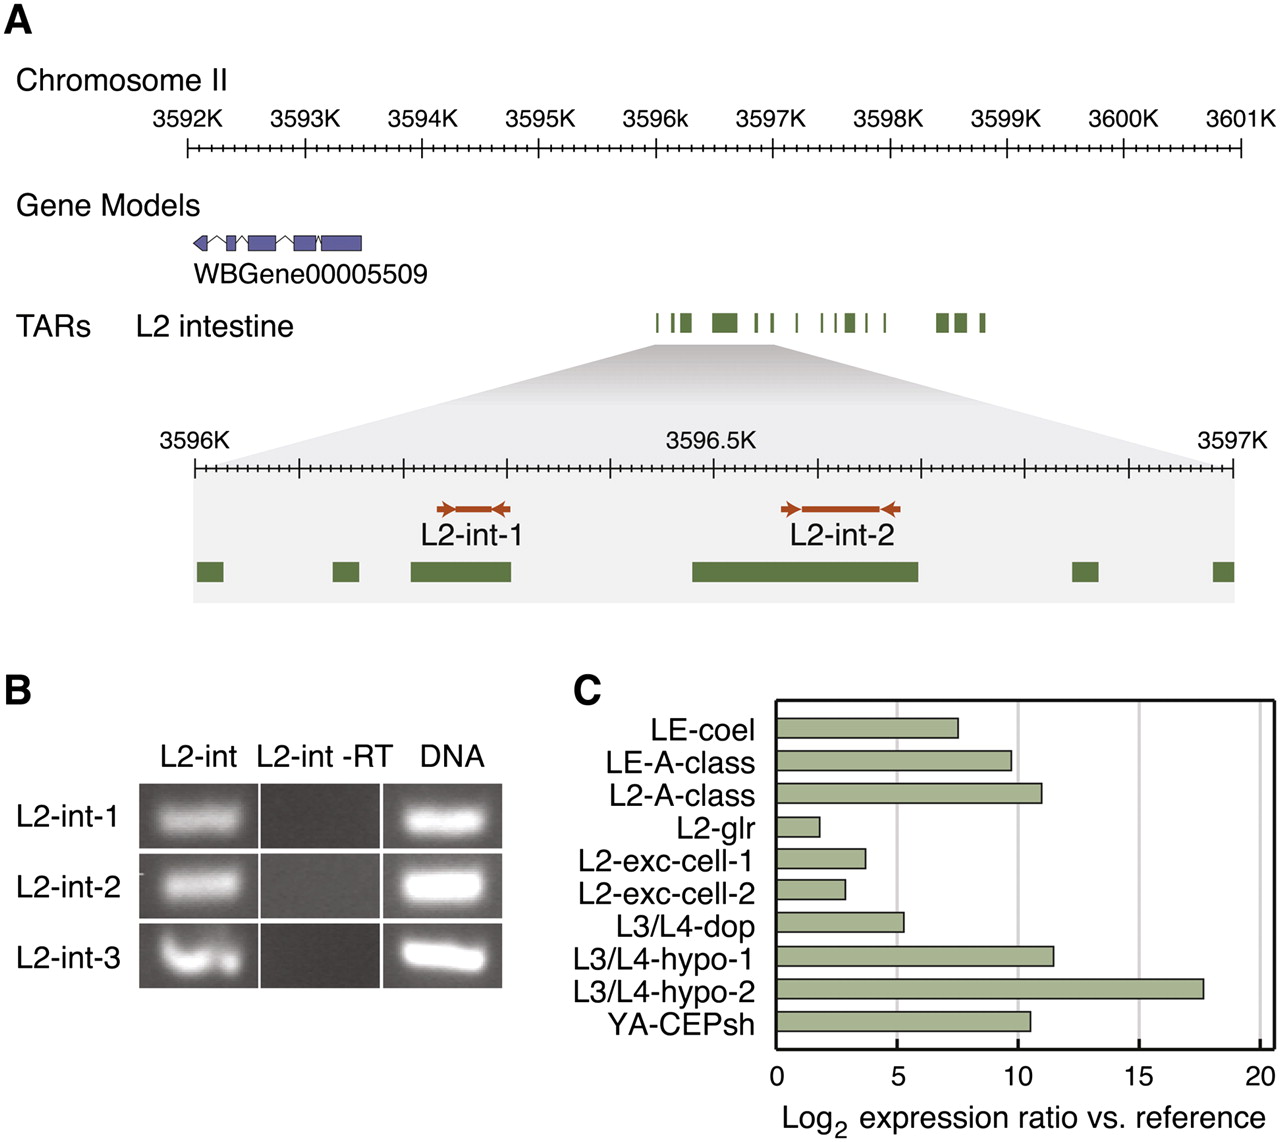
Figure 3.
mSTAD detects TARs corresponding to protein-coding genes and to novel transcribed regions. (A) Novel TARs detected in larval L2 intestine. Enlarged region shows location of primers and predicted RT-PCR amplicon from two TARs, L2-int-1 and L2-int-2. (B) RT-PCR detects novel TARs expressed in specific cell types. TARs L2-int-1, 2, 3 are detected in RNA isolated from the larval L2 intestine (L2-int) but are not amplified from RNA in the absence of reverse transcriptase (L2-int-RT). (C) qPCR validates enrichment of novel TARs in specific cell types. Log2 ratio of enrichment in specific tissue versus corresponding reference samples (Table 1).


