
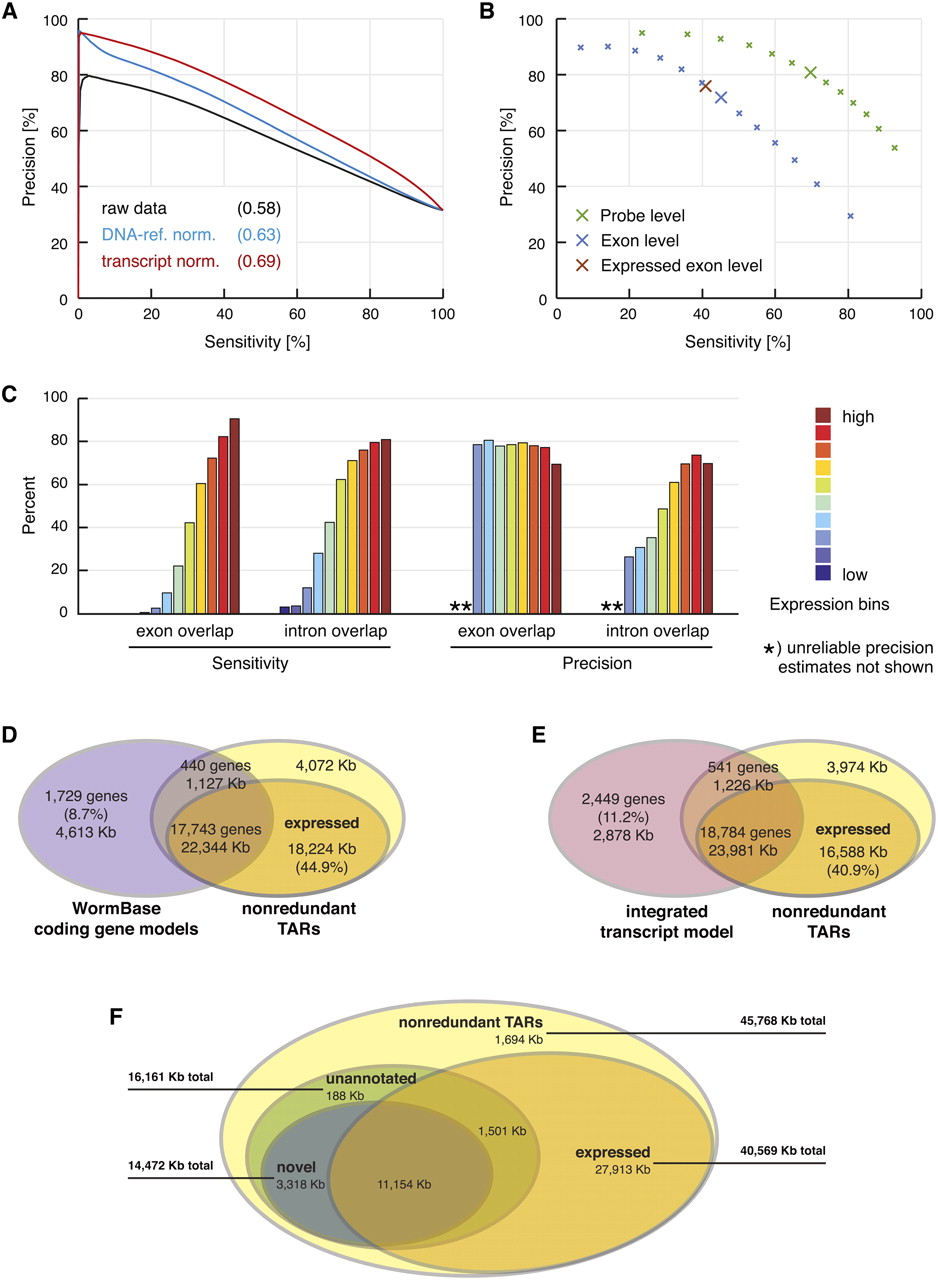
De novo transcript identification with mSTAD and overlap of TARs with annotated and experimentally defined gene models. (A) Transcript normalization (red) improved exon probe recognition over raw data (black) and compared with normalization using genomic DNA hybridization as reference (blue). Sensitivity and precision were estimated after thresholding the intensity data with increasing cutoffs in a fivefold cross-validation. Sensitivity is defined as the percentage of exon probes with signal above the threshold among all annotated exon probes. Precision is defined as the percentage of annotated exon probes among those with signal above the threshold (see Methods). Values in parentheses indicate area under the curve. Based on data from LE-ref (see Table 1). (B) Cross-validation accuracy of mSTAD for probes (green), for exons (blue), and for exons with independently confirmed expression (brown). For exons, sensitivity is defined as the percentage of annotated exons for which all corresponding tiling probes were predicted as exonic by mSTAD. Precision is defined as the percentage of predicted exons for which all probes are annotated as such. Definitions for probes are as in A but with respect to predictions by mSTAD. Exon-level evaluation was repeated with the subset of predicted exons also detected as expressed by a statistical test (see Expressed Exon Level). Enlarged crosses correspond to predictions used for subsequent analysis. Based on data from LE-ref (Table 1). (C) Accuracy of exon and intron recognition increased with gene expression. Colored bars correspond to equally sized expression bins. Here exon overlap sensitivity equals the percentage of predicted exons, which overlap by at least 75% of their length with annotated exons. Exon overlap precision equals the percentage of exon predictions overlapping with annotated exons (by 75% or more) among all predicted exons (intron overlap sensitivity and precision are defined analogously with respect to predicted and annotated introns). Based on data from LE-ref (Table 1). (D) Overlap between nonredundant TARs (nrTARs), the portion detected as expressed and annotated coding gene models. About 45% of expressed nrTAR bases do not overlap with annotated coding gene models. (E) Overlap between TARs and the modENCODE integrated transcript model (Hillier et al. 2009; Gerstein et al. 2010). About 41% of expressed nrTAR bases do not overlap with the integrated transcript model. (F) Unannotated and novel TARs and their overlap with TARs expressed above array background. Unannotated TARs are defined as TARs without significant overlap (≥20 bp) with exons of annotated coding genes, pseudogenes, and ncRNAs. Novel TARs are defined as the subset of unannotated TARs without significant overlap (≥20 bp) with exons in the integrated transcript model (for details, see main text).


