
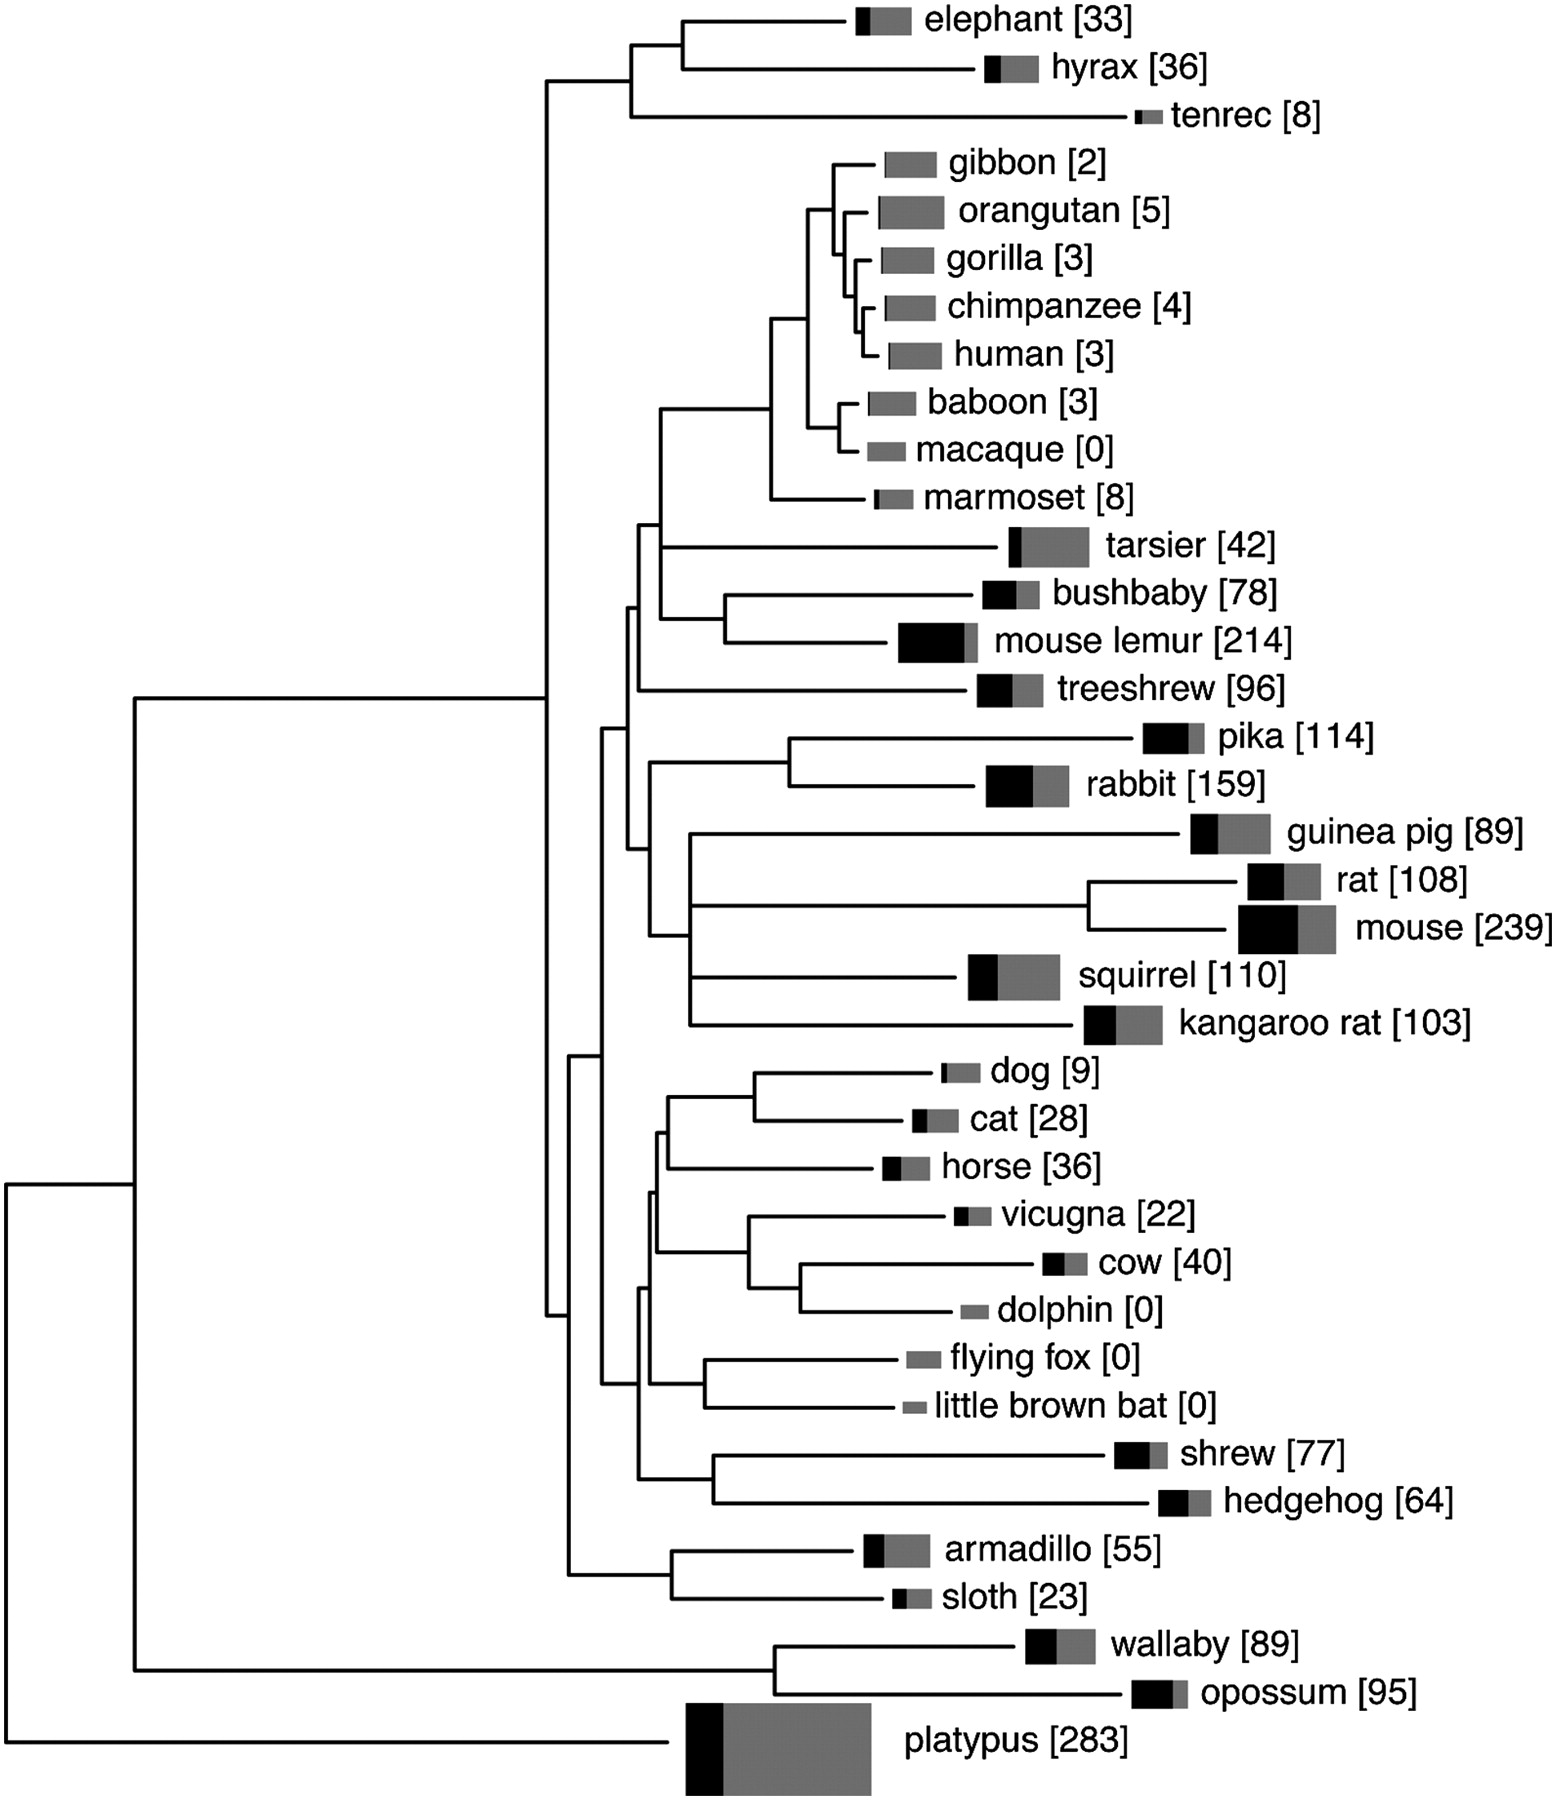
Numbers of intact V1Rs and V1R pseudogenes we estimate to be present in various mammalian genomes. The tree depicts mammalian species relationships and is adapted from supporting Figure 6E of Margulies et al. (2005) (for details, see Supplemental Methods). Black and gray rectangles indicate the size of the V1R repertoire in each species—the total area (black plus gray) is proportional to total V1R repertoire size, and the relative size of the black area reflects the proportion of V1Rs that are intact. Numbers in square brackets after species names are the numbers of intact V1Rs. The estimates derived from analyses of Trace Archive data have been adjusted using the fitted curves shown in Figure 1 so that they are comparable to numbers obtained from draft-level whole-genome assemblies. The human and mouse genome assemblies are exceptions in that they are “finished” and likely deal better with very recent duplicates than do any of the other assemblies. Numbers for all other species likely represent underestimates of true V1R numbers.


