
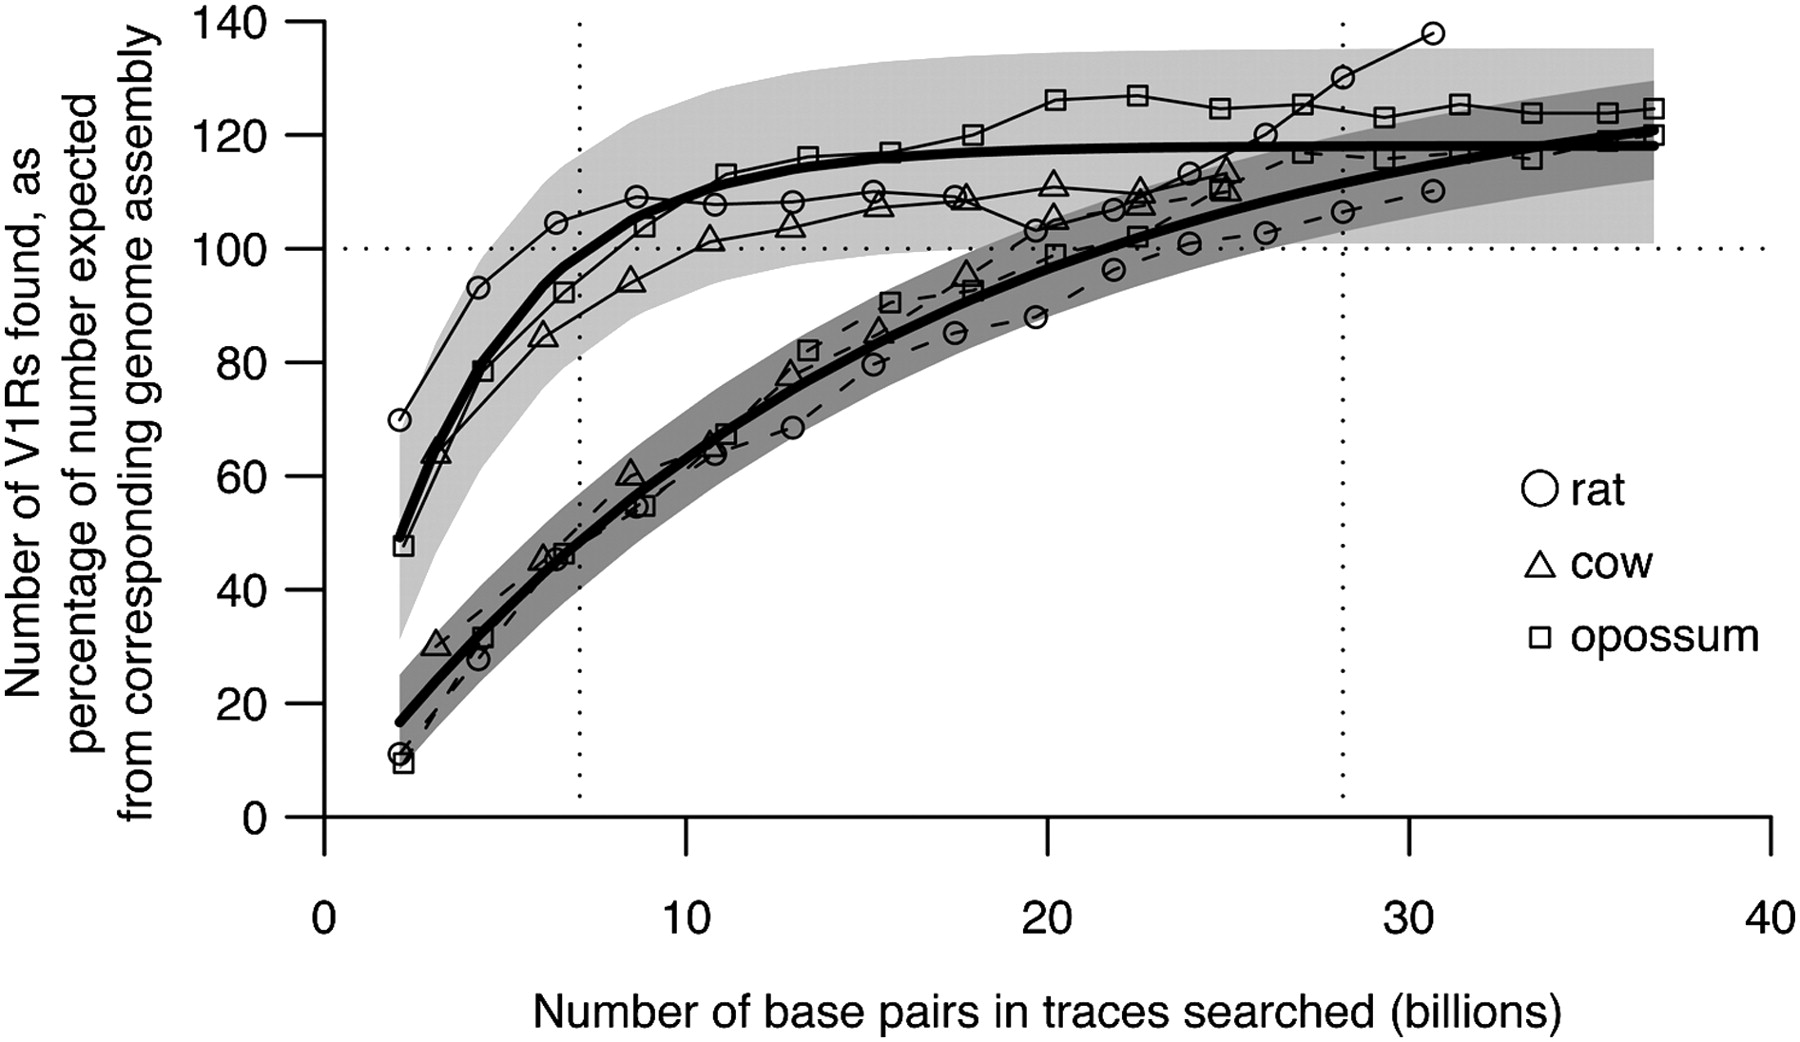
Proof-of-principle studies show that Trace Archive data can provide good estimates of V1R repertoire sizes. We used sequence traces from rat (circles), cow (triangles), and opossum (squares) to create artificial Trace Archive data sets of varying sizes. We compared the numbers of V1Rs found using these artificial data sets with the numbers expected based on analysis of draft genome assemblies to determine what proportion was successfully found (expressed as a percentage). As expected, the proportion of total V1Rs found increases as trace data set size increases (solid lines). Likewise, as trace data set size increases, the proportion of intact V1Rs found also increases (dashed lines), but more slowly than does the total V1R number. The thicker lines show curves fitted to these data using Poisson models based on Lander and Waterman's predictions (Lander and Waterman 1988; see Supplemental Methods). The vertical dotted lines show the minimum and maximum trace data set sizes used in our study; within these limits, coverage is reasonably high, and actual numbers follow modeled numbers well. Shaded gray areas show the 95% prediction limits resulting from our modeling.


