
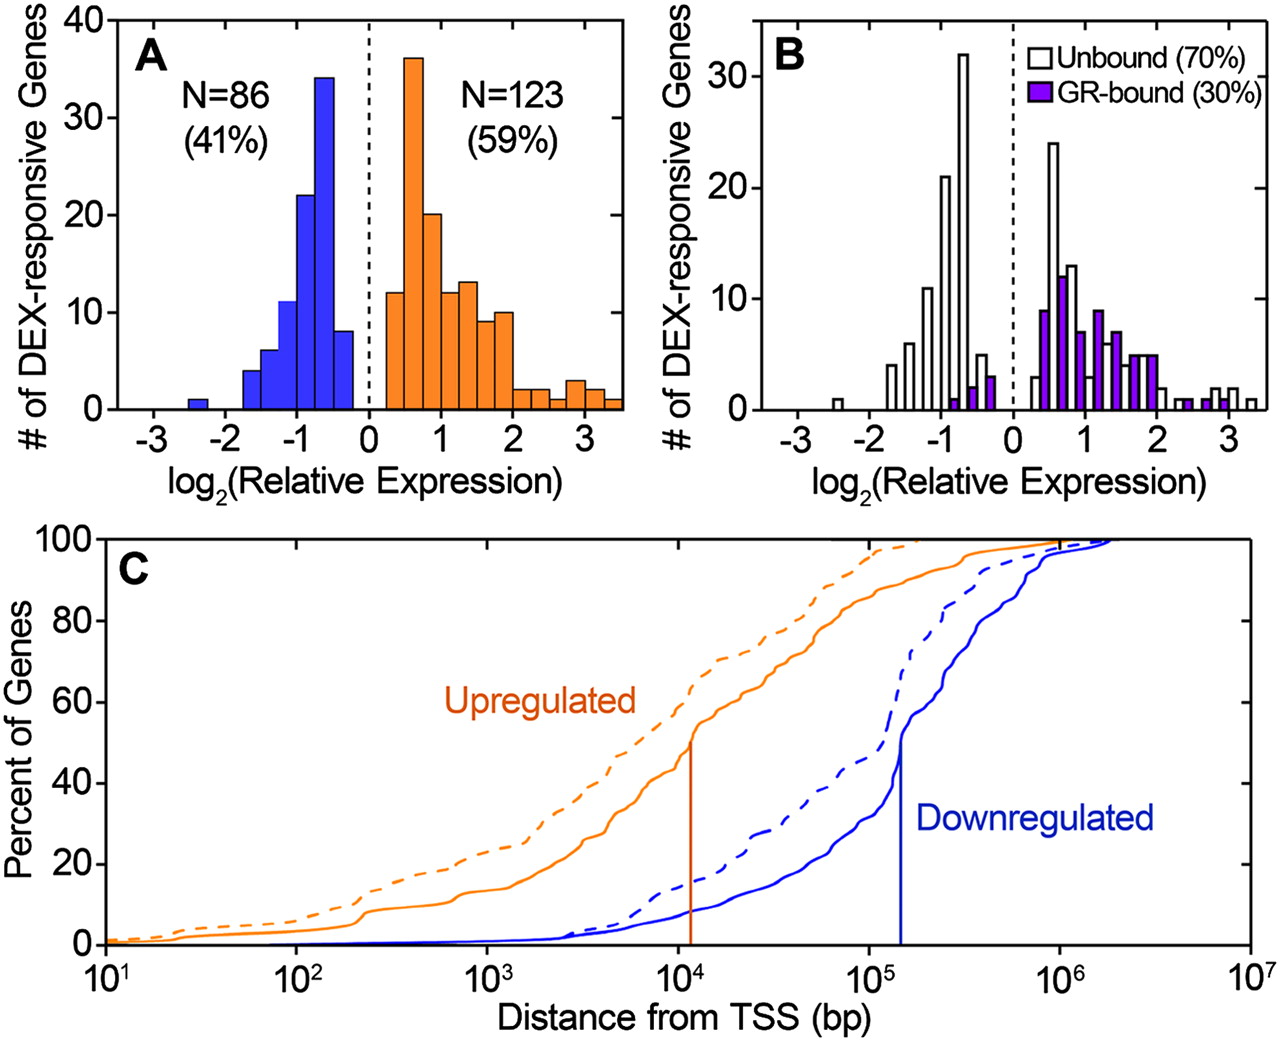
Gene expression response to dexamethasone and overlap with glucocorticoid receptor binding. (A) Histogram showing the distribution of expression change for the DEX-responsive genes, as measured with RNA-seq. DEX-induced genes are shown in orange, while DEX-repressed genes are shown in blue. (B) Comparison of DEX response in genes that have GR binding within 10 kb of their transcription start site (purple) and genes without GR binding in the same region (white). (C) Percentage of DEX-responsive genes (y-axis) that have GR binding within a given distance from the transcription start site (x-axis). Orange line, up-regulated genes; blue line, down-regulated genes. Vertical lines indicate median distance to nearest binding site. Dashed lines indicate binding sites called with a lower confidence threshold of FDR < 5%.


