
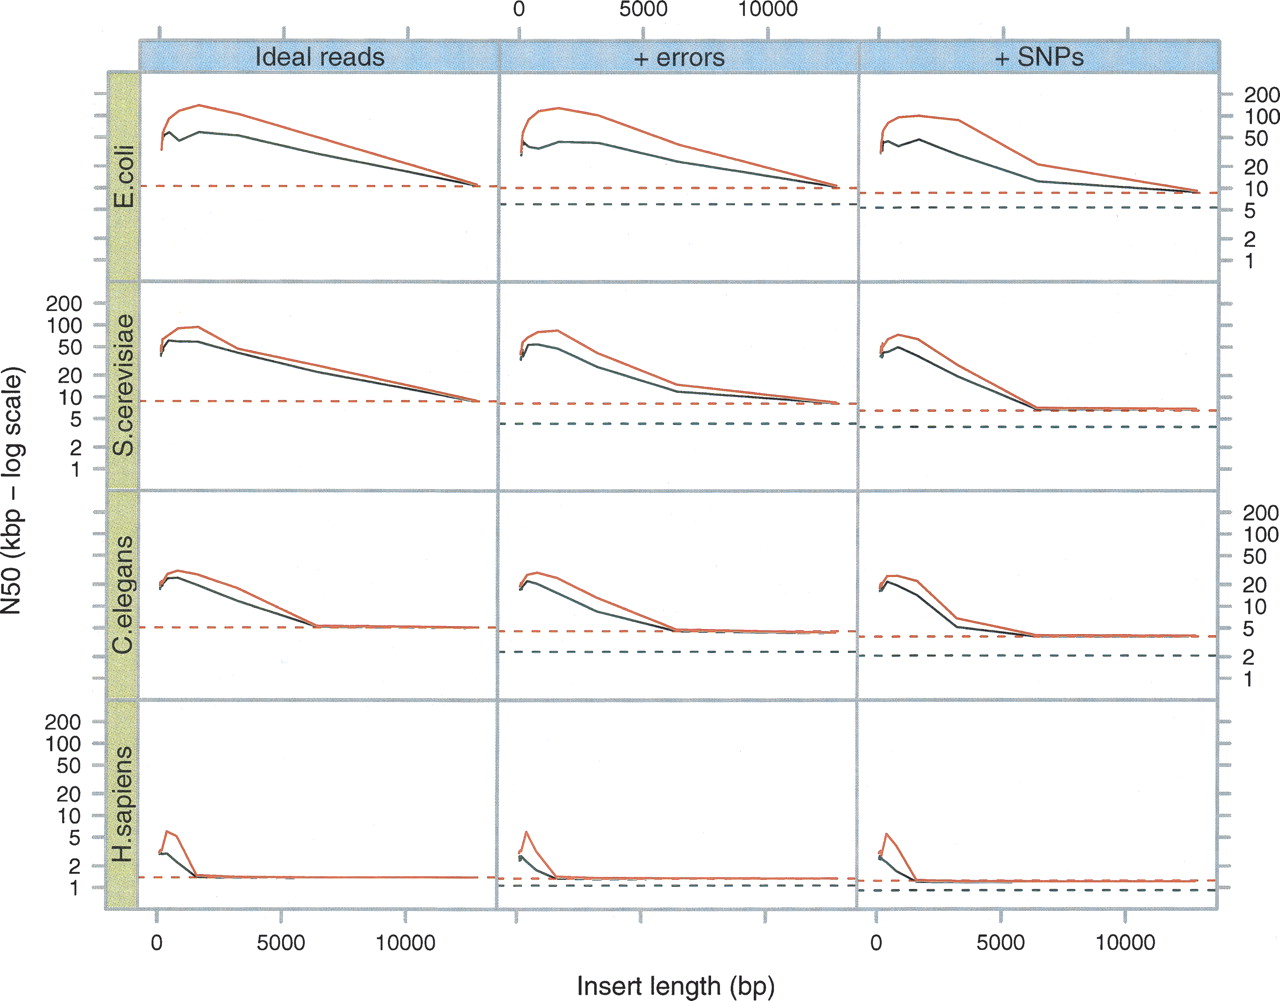
Figure 6.
Breadcrumb performance on simulated data sets. As in Figure 3, we sampled 5-Mb DNA sequences from four different species (E. coli, S. cerevisiae, C. elegans, and H. sapiens, respectively) and generated 50× read sets. The horizontal lines represent the N50 reached at the end of Tour Bus (see Fig. 3) (broken black line) and after applying a 4× coverage cutoff (broken red line). Note how the difference in N50 between the graph of perfect reads and that of erroneous reads is significantly reduced by this last cutoff. (Black curves) The results after the basic Breadcrumb algorithm; (red curves) the results after super-contigging.


