
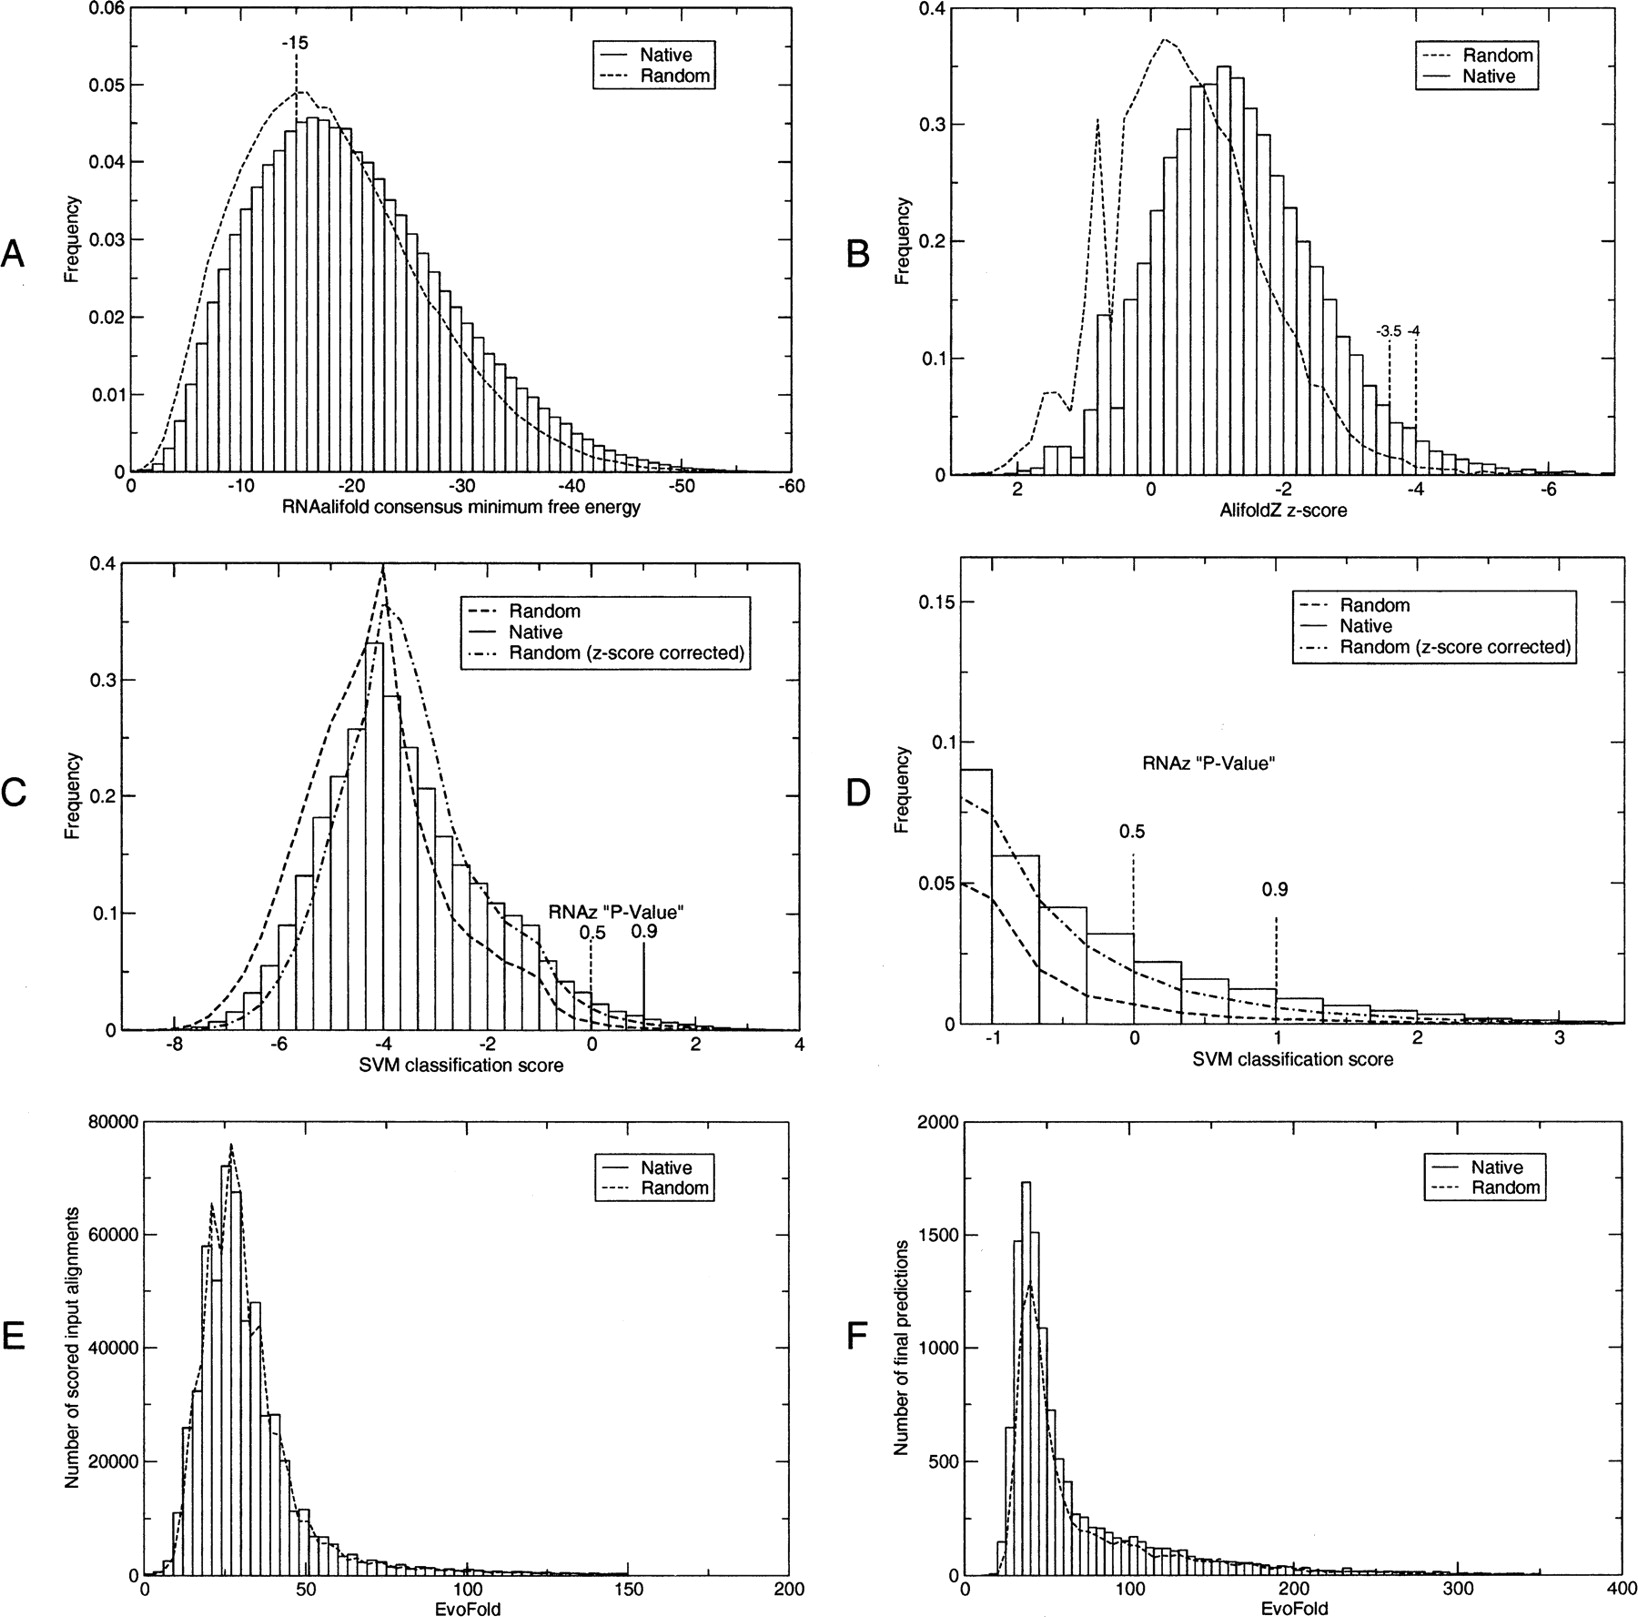
Score distribution of AlifoldZ, RNAz, and EvoFold computed for all input alignments. (A) Minimum free energies of the consensus structures as computed by RNAalifold. Note that more negative scores correspond to more stable/conserved consensus structures. (B) The significance of the consensus MFEs are estimated by AlifoldZ for all consensus structures with MFE < −15 resulting in normalized Z-scores. Also here negative values mean more stable and conserved structures. The two significance cutoffs used throughout this work are indicated. (C) RNAz classifies alignments using a support vector machine. The distribution of SVM decision variables is shown as well as the two significance cutoffs, which are expressed as “classification probabilities,” P. (D) Enlarged tail of C. (E) Raw EvoFold scores on the original input alignments. (F) EvoFold scores after extracting the predicted substructure, filtering weak structures (see Methods), and rescoring. The histogram shows all predictions of which the top-scoring 50% were chosen as the high significance prediction set.


