
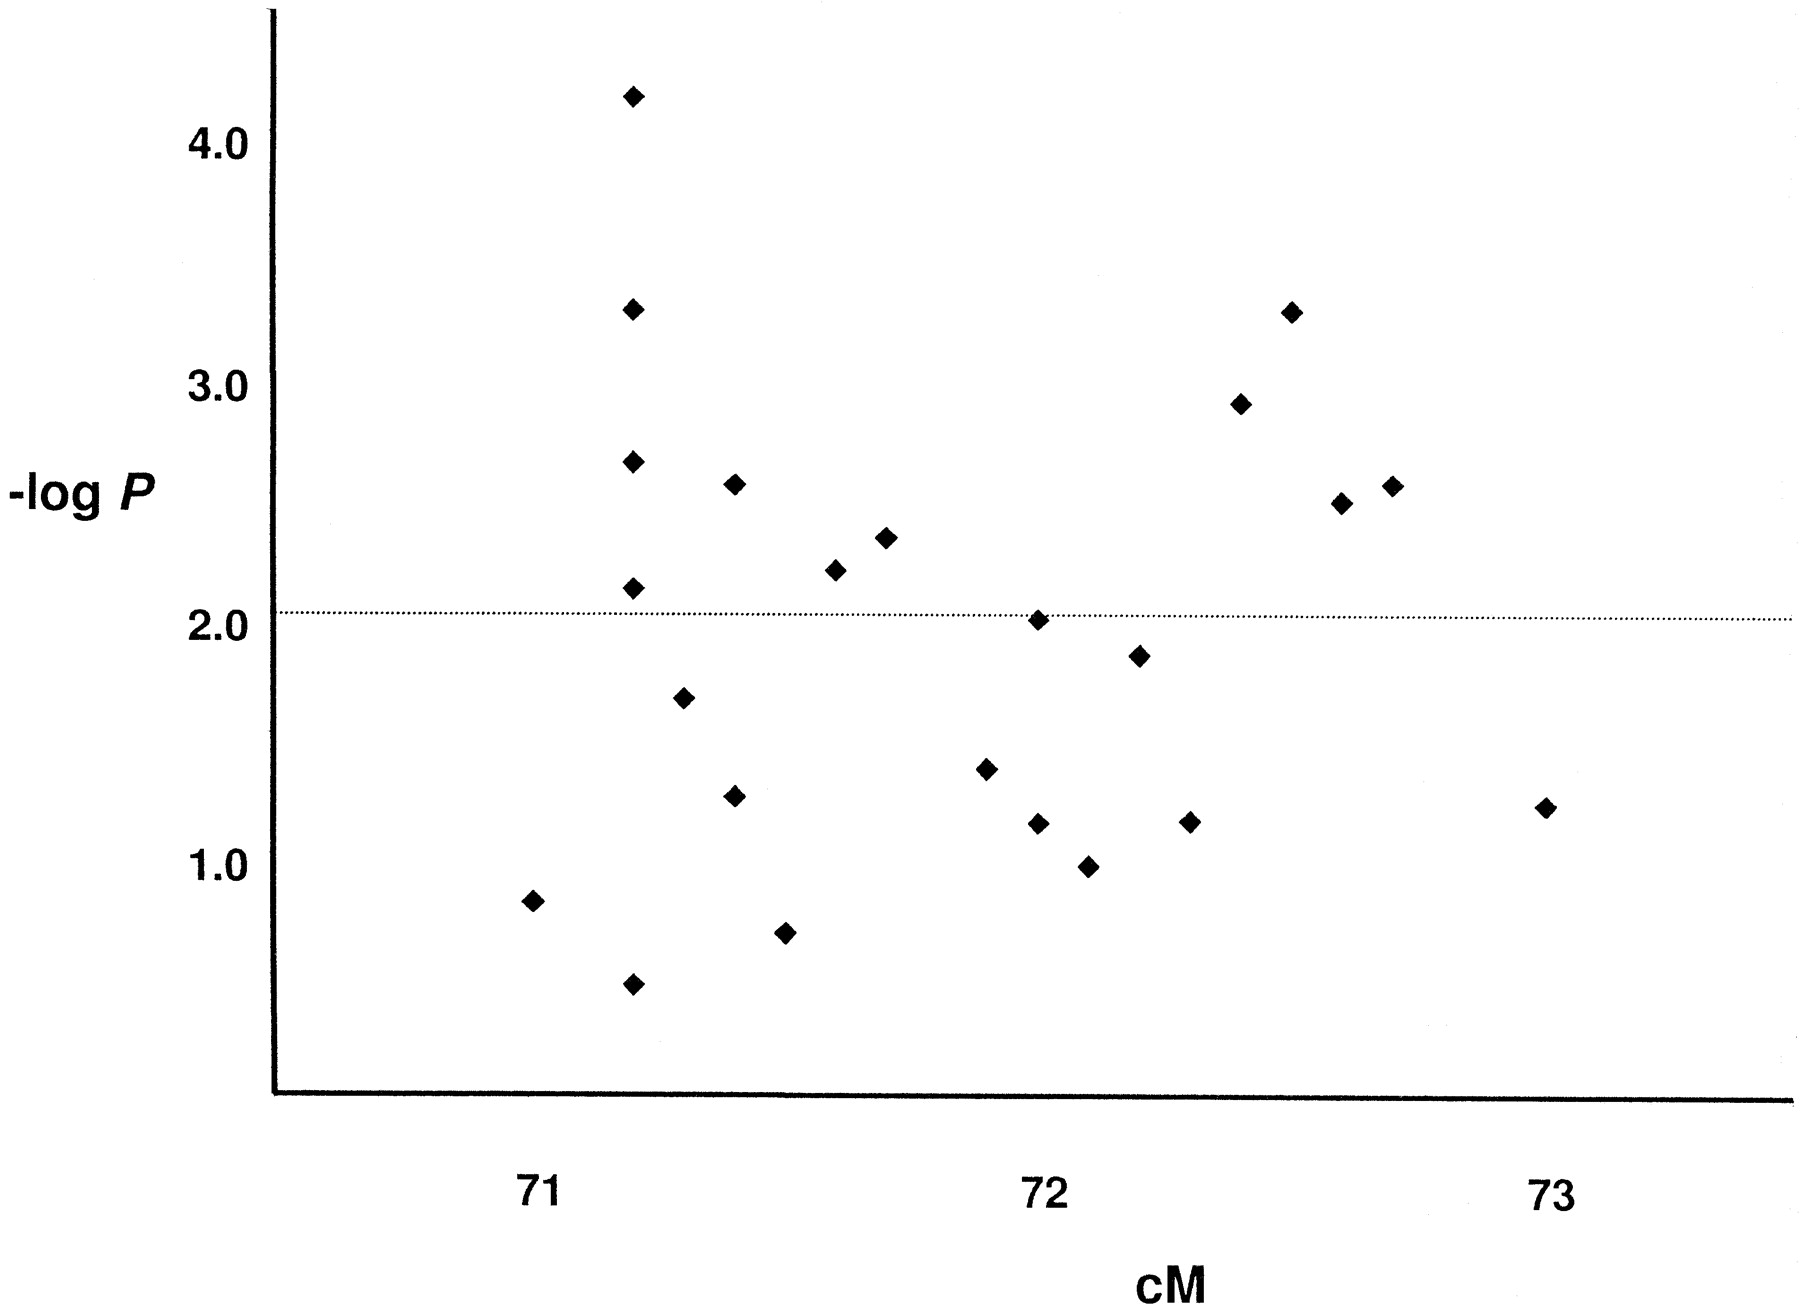
Figure 1.
Composite genetic and physical map of the telomeric region of mouse chromosome 6 for LD mapping of the Pas1 locus. Statistical significance of LD between marker polymorphisms and phenotype was estimated by Fisher’s exact test and expressed as negative logarithm of P values (−log P). The dotted line represents the P = 0.01 (−log P = 2) cutoff significance value. Each point represents either a single genetic marker or multiple markers in the same position with the same −log P value (Table 1).


