
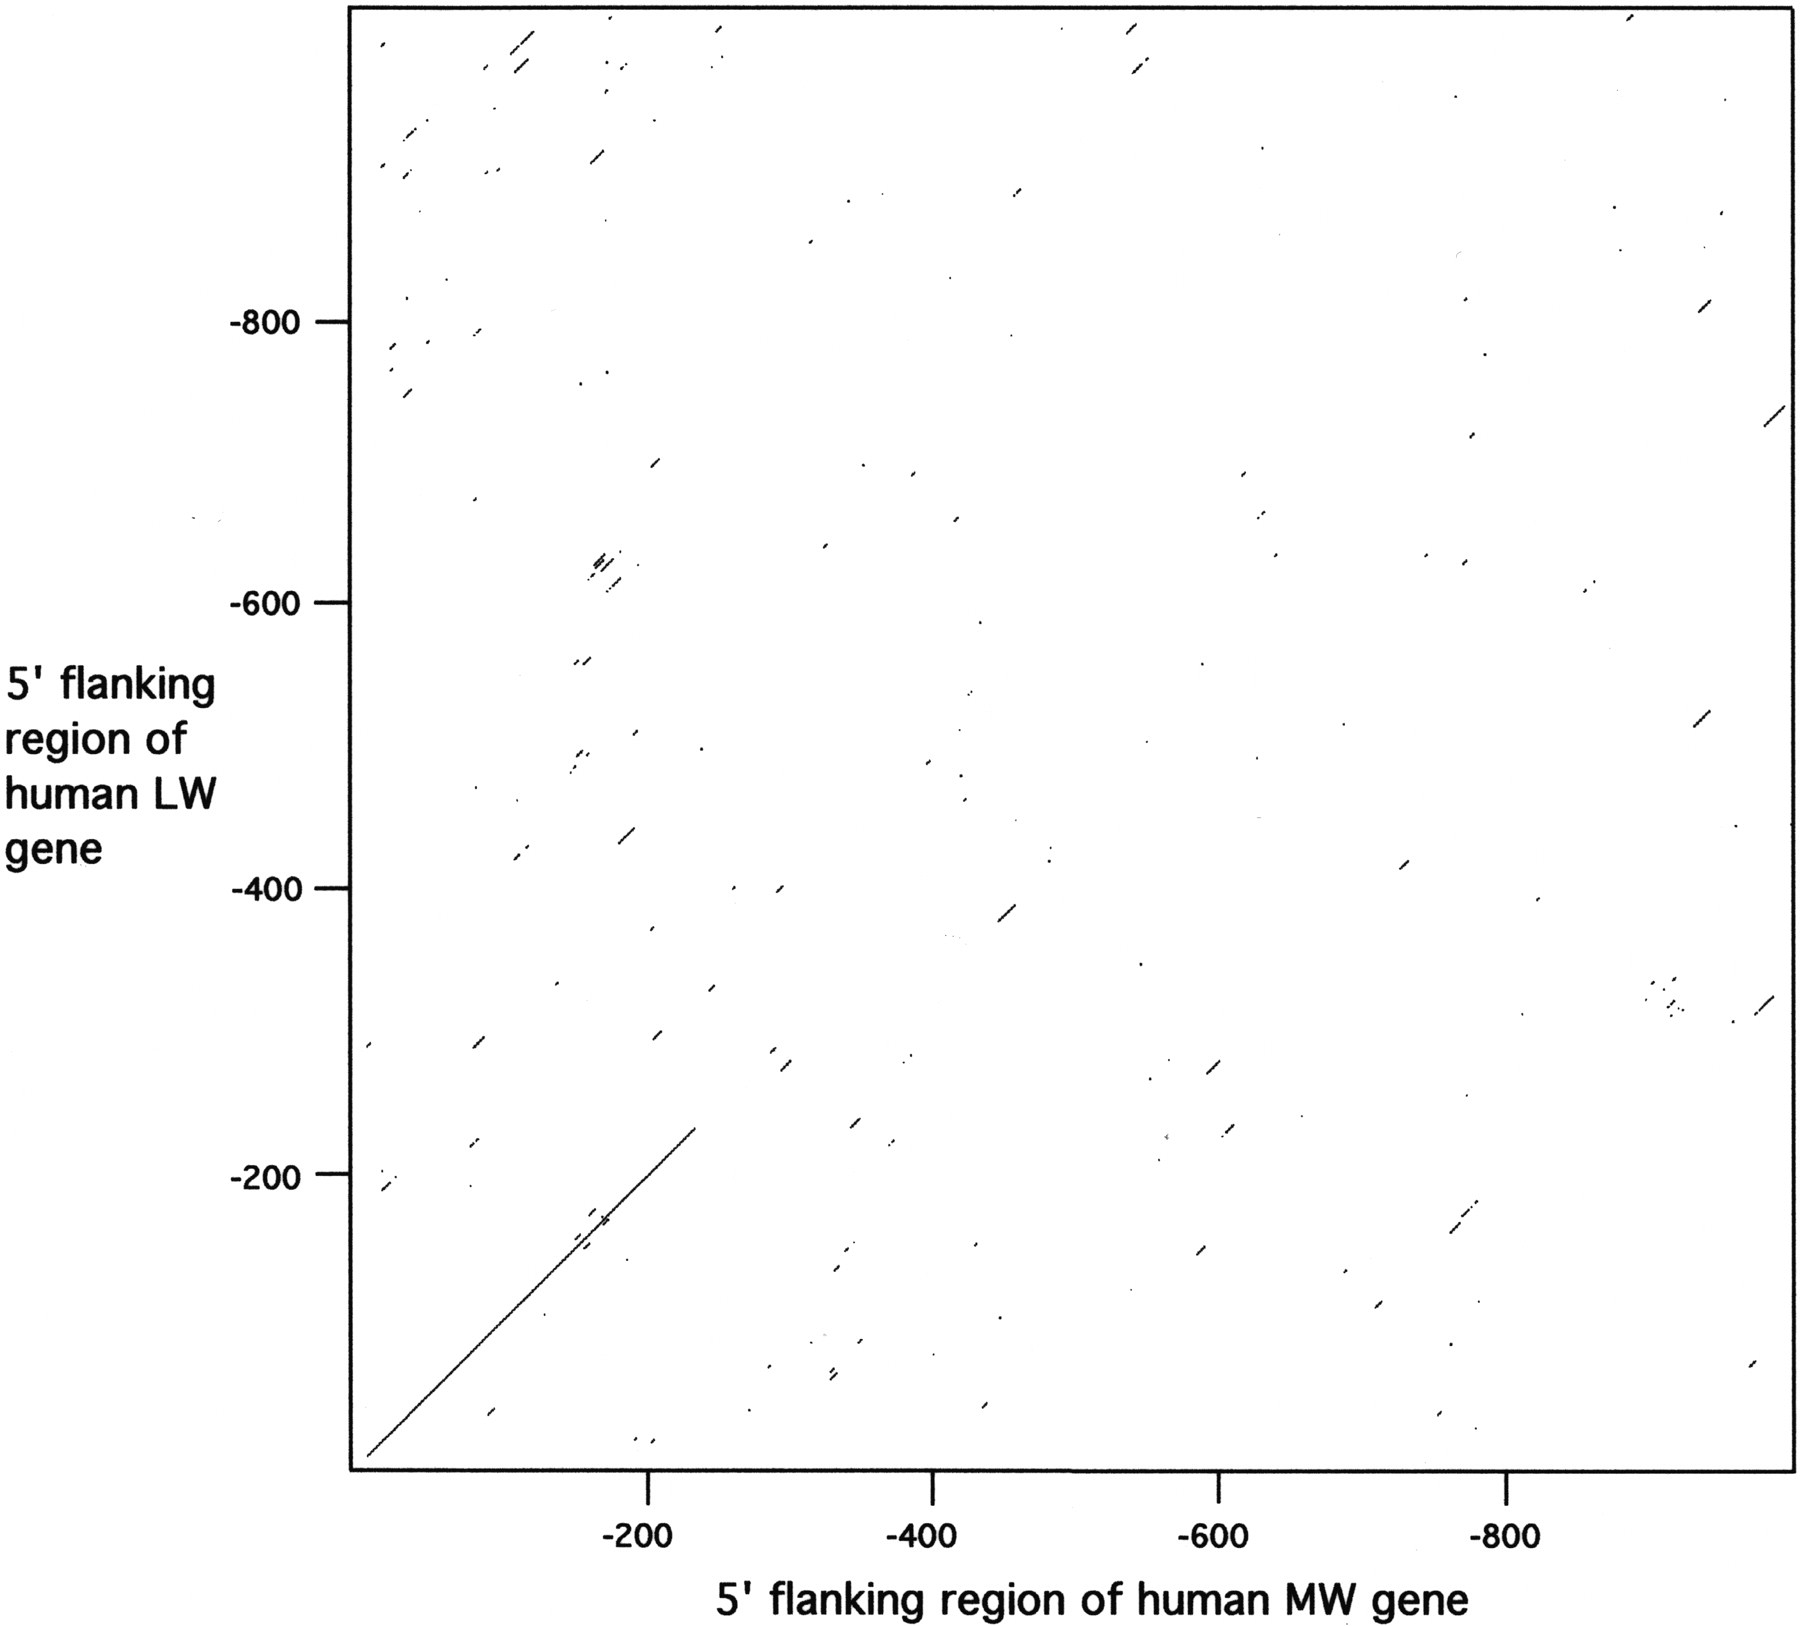
Figure 1.
Dot matrix plot of human MW and LW upstream region. The parameters for comparison were set at 60% identity for a sliding window of 10 nucleotides. The presence of a diagonal line that passes through the origin indicates homology at the same position in both sequences. Note that no continuous lines are present beyond position −236.


