
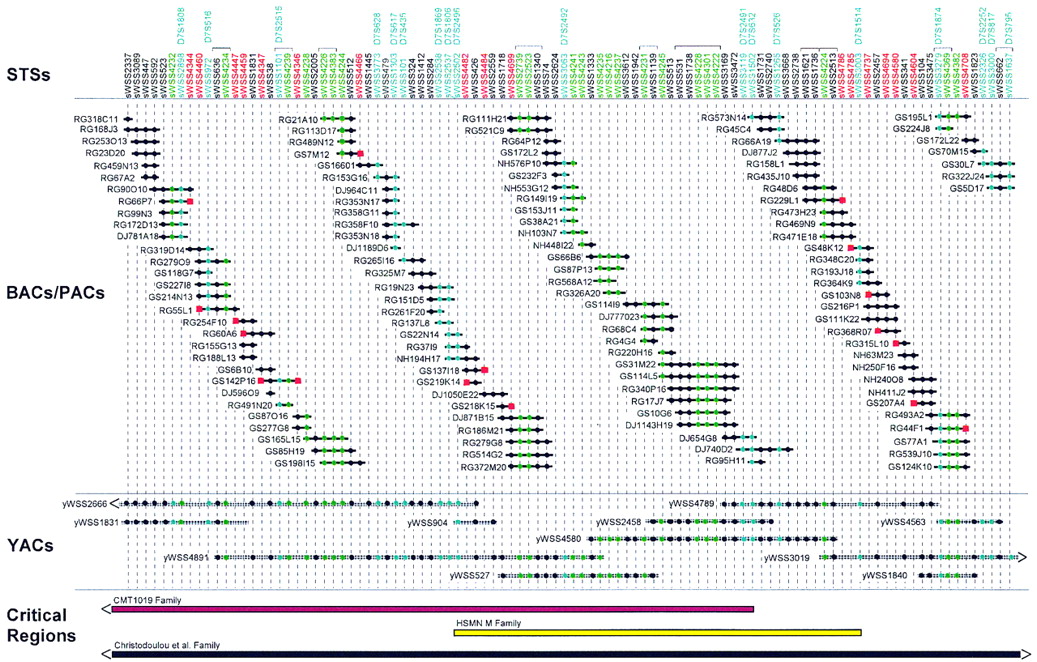
Clone-based physical map of the CMT2D critical region. A bacterial clone (BAC and PAC)-based STS-content map of theCMT2D critical region is depicted (oriented with 7pterleft and 7cen right). The deduced positions of 100 STSs are depicted along the top, with the indicated clones shown as horizontal lines below. Relevant information about the STSs is available in GenBank (see http://www.ncbi.nlm.nih.gov). Bacterial clones are named starting with the following prefixes that reflect their library of origin: (RG) Research Genetics BAC library; seehttp://www.resgen.com, (GS) Genome Systems BAC library; seehttp://www.genomesystems.com, (NH) Roswell Park Cancer Institute BAC library RPCI-11; see http://bacpac.med.buffalo.edu, and (DJ) Roswell Park Cancer Institute PAC library RPCI-4 or RPCI-5. A solid circle indicates that the STS is confirmed to be present in that clone by PCR testing. When an STS corresponds to a BAC insert end, its name is shown in red and a red square is present at the end of the clone from which it was derived. STSs corresponding to genetic markers and genes/ESTs are indicated in blue and green, respectively (both the STS name and the corresponding solid circles). In the case of the genetic markers, the corresponding D7S number is indicated above the name of the STS. Groups of STSs that could not be ordered based on the STS content of the BACs, PACs, and YACs are indicated with brackets above their names. STSs are depicted in an equidistant fashion from one another. The indicated BAC/PAC overlaps were confirmed by restriction enzyme digest-based fingerprint analysis (data not shown) (Marra et al. 1997). Shown below the BACs and PACs is a small, representative set of YACs spanning the region [see Bouffard et al. (1997b) andhttp://www.nhgri.nih.gov/DIR/GTB/CHR7 for additional details about the complete YAC contig map]. The YACs were not tested for the presence of some of the newly developed STSs; in these cases, a solid circle is not indicated at the appropriate position in the clone. Along thebottom are depicted the CMT2D critical regions as defined by genetic analysis of the CMT1019 family (Ionasescu et al. 1996; see Fig. 1), the HSMN M family (Sambuughin et al. 1998), and the family reported by Christodoulou et al. (1995). Note that the end(s) of the critical regions defined by the first and last families extend beyond the interval covered by the depicted contig map.


