
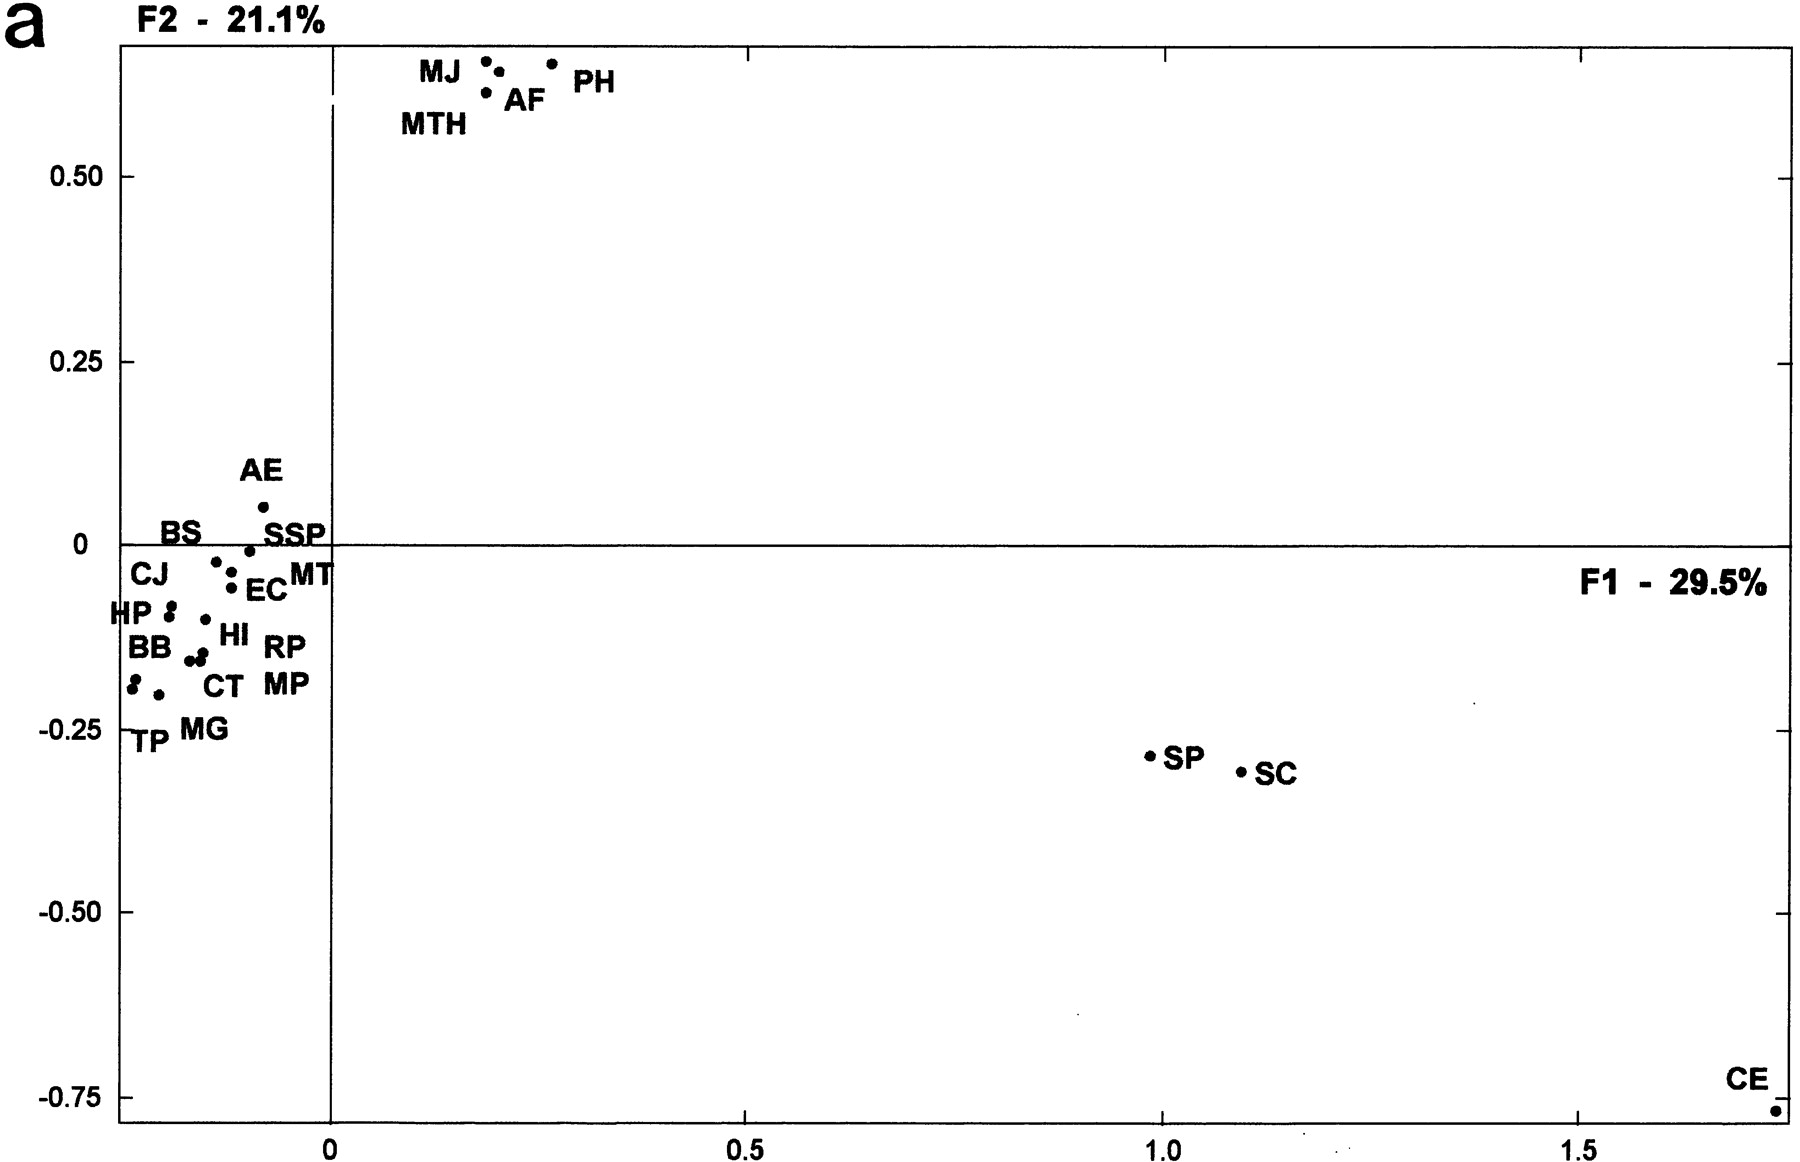
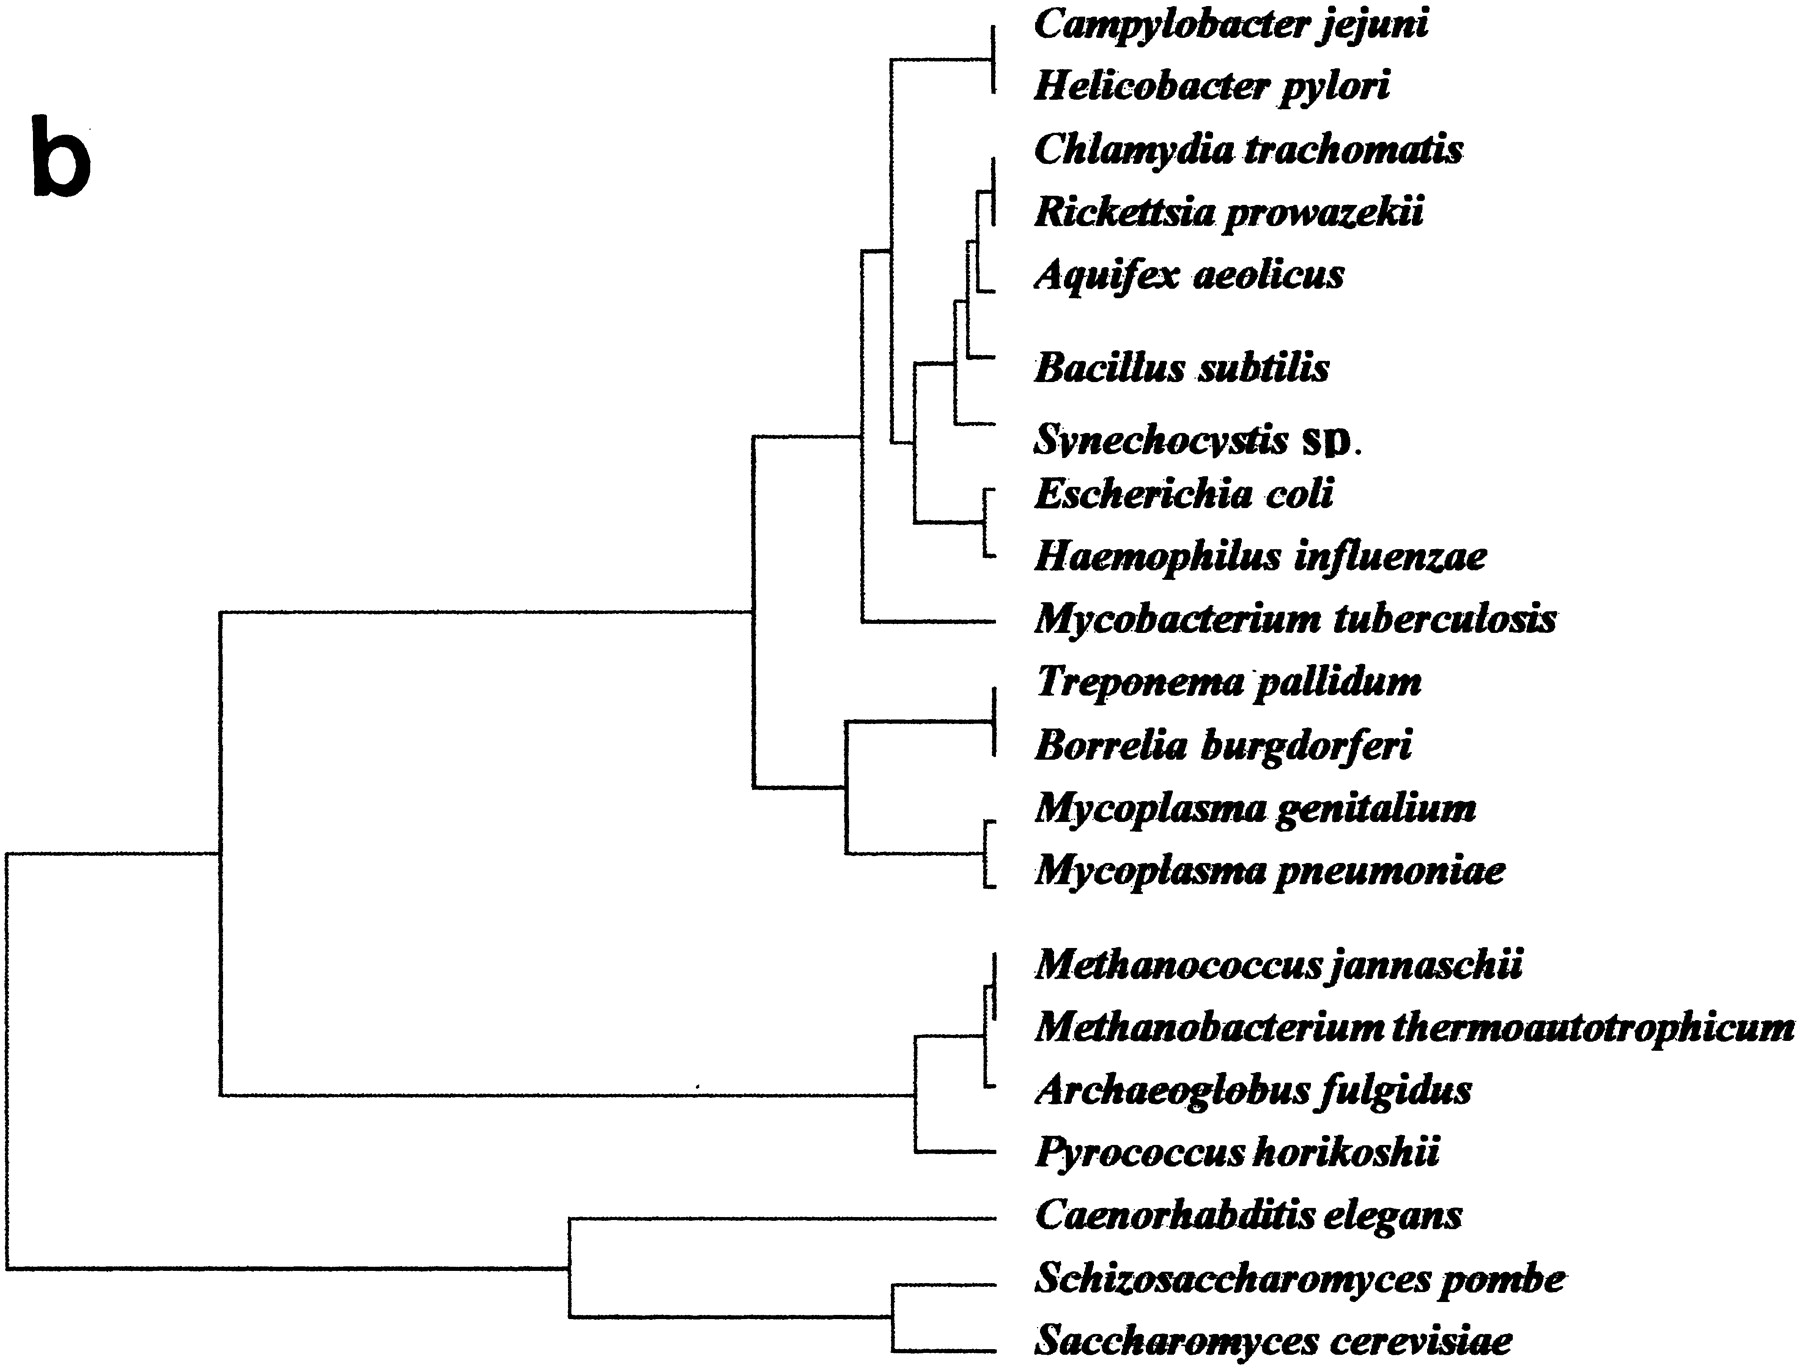
(a) Factorial representation of the constituent ancestry in each genome. First and second axes (F1 and F2) represent, respectively, 29.5% and 21.1% of the total information included in the ancestry weight matrix resulting from the organism’s partitions (see Methods). Organismal distribution on this factorial plane is very similar to that in Fig. 1. Human and mouse, for which no accurate ancestral gene duplications can be presently calculated, were not considered in this analysis (abbreviations are as in Table 1). (b) Genomic tree for the considered organisms (minus human and mouse) as obtained from the whole factorial space resulting from the corresponding analysis (see Fig. 2a for methods of analysis).


