
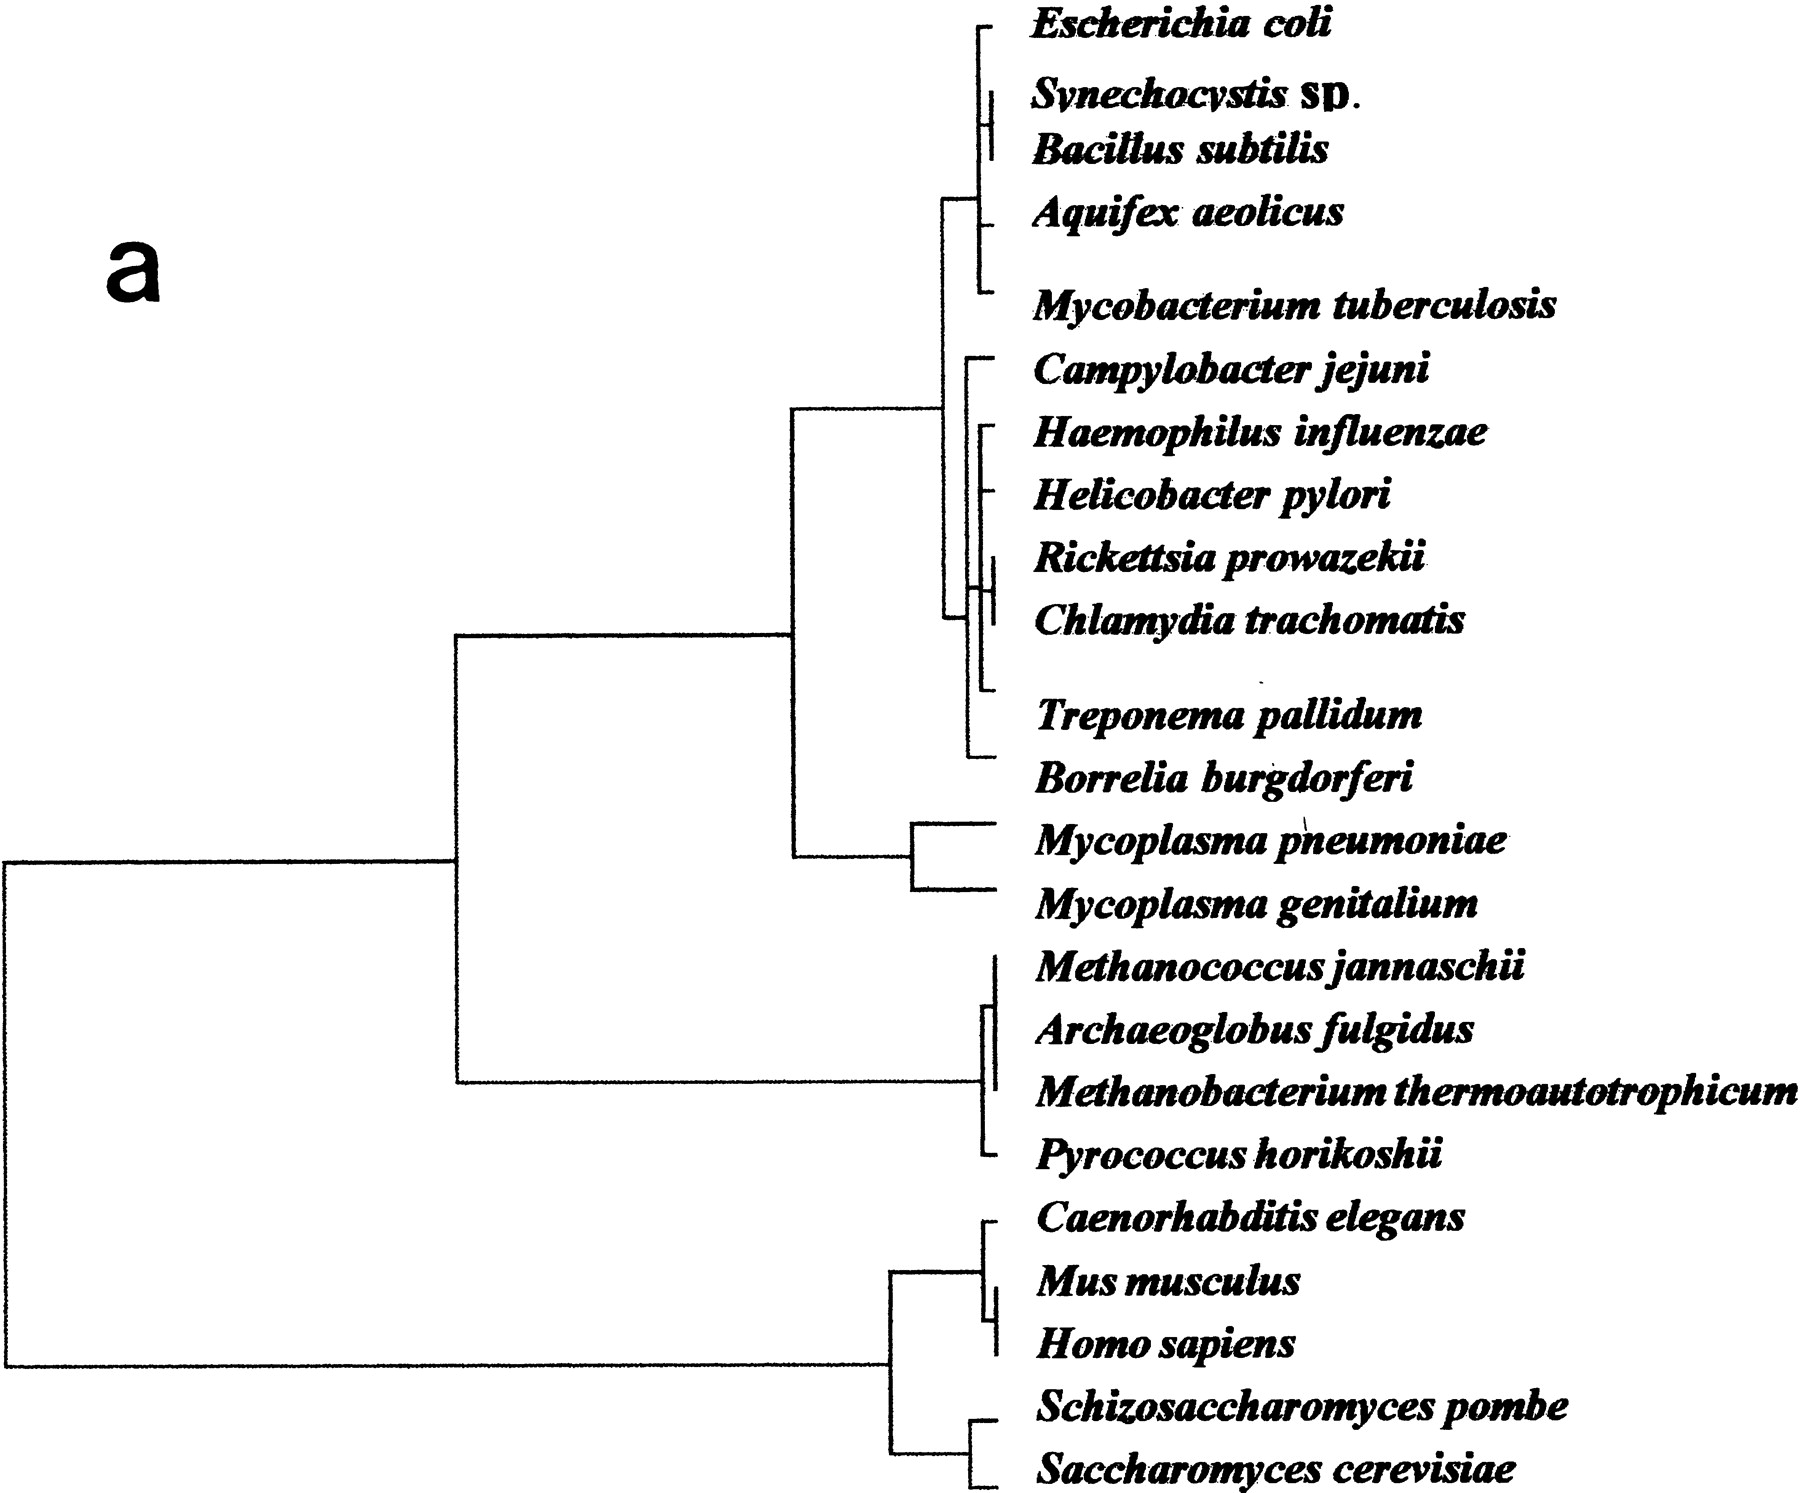
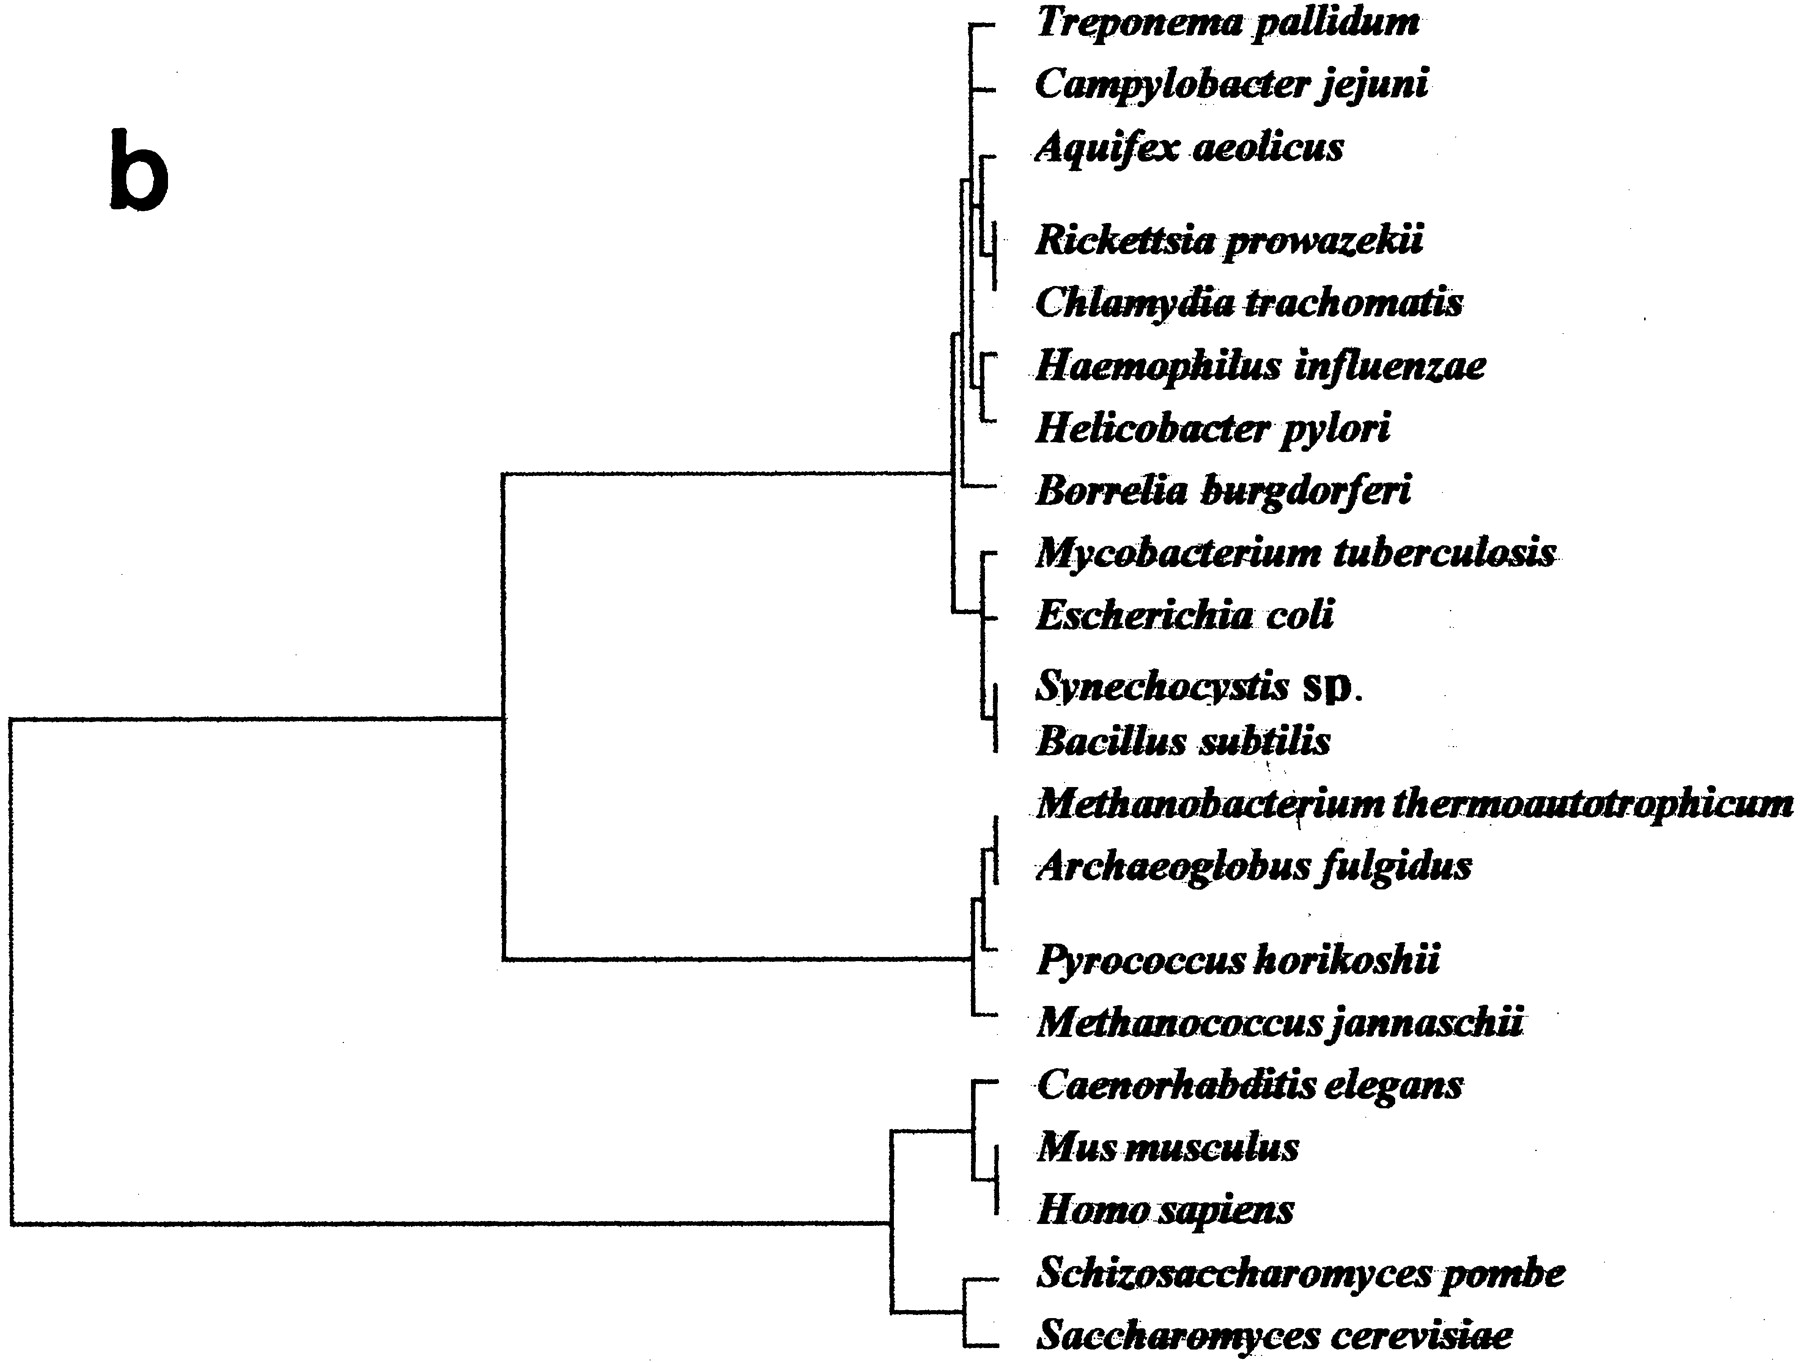
Figure 2.
Genomic tree. (a) This tree is obtained by a hierarchical classification of the organisms on the basis of their neighborhood distances. Distances between all pairs of organisms are calculated in the factorial space obtained by correspondence analysis. Horizontal lines between nodes are proportional to their similarity. (b) Same tree excluding data from M. genitalium and M. pneumoniae.


