
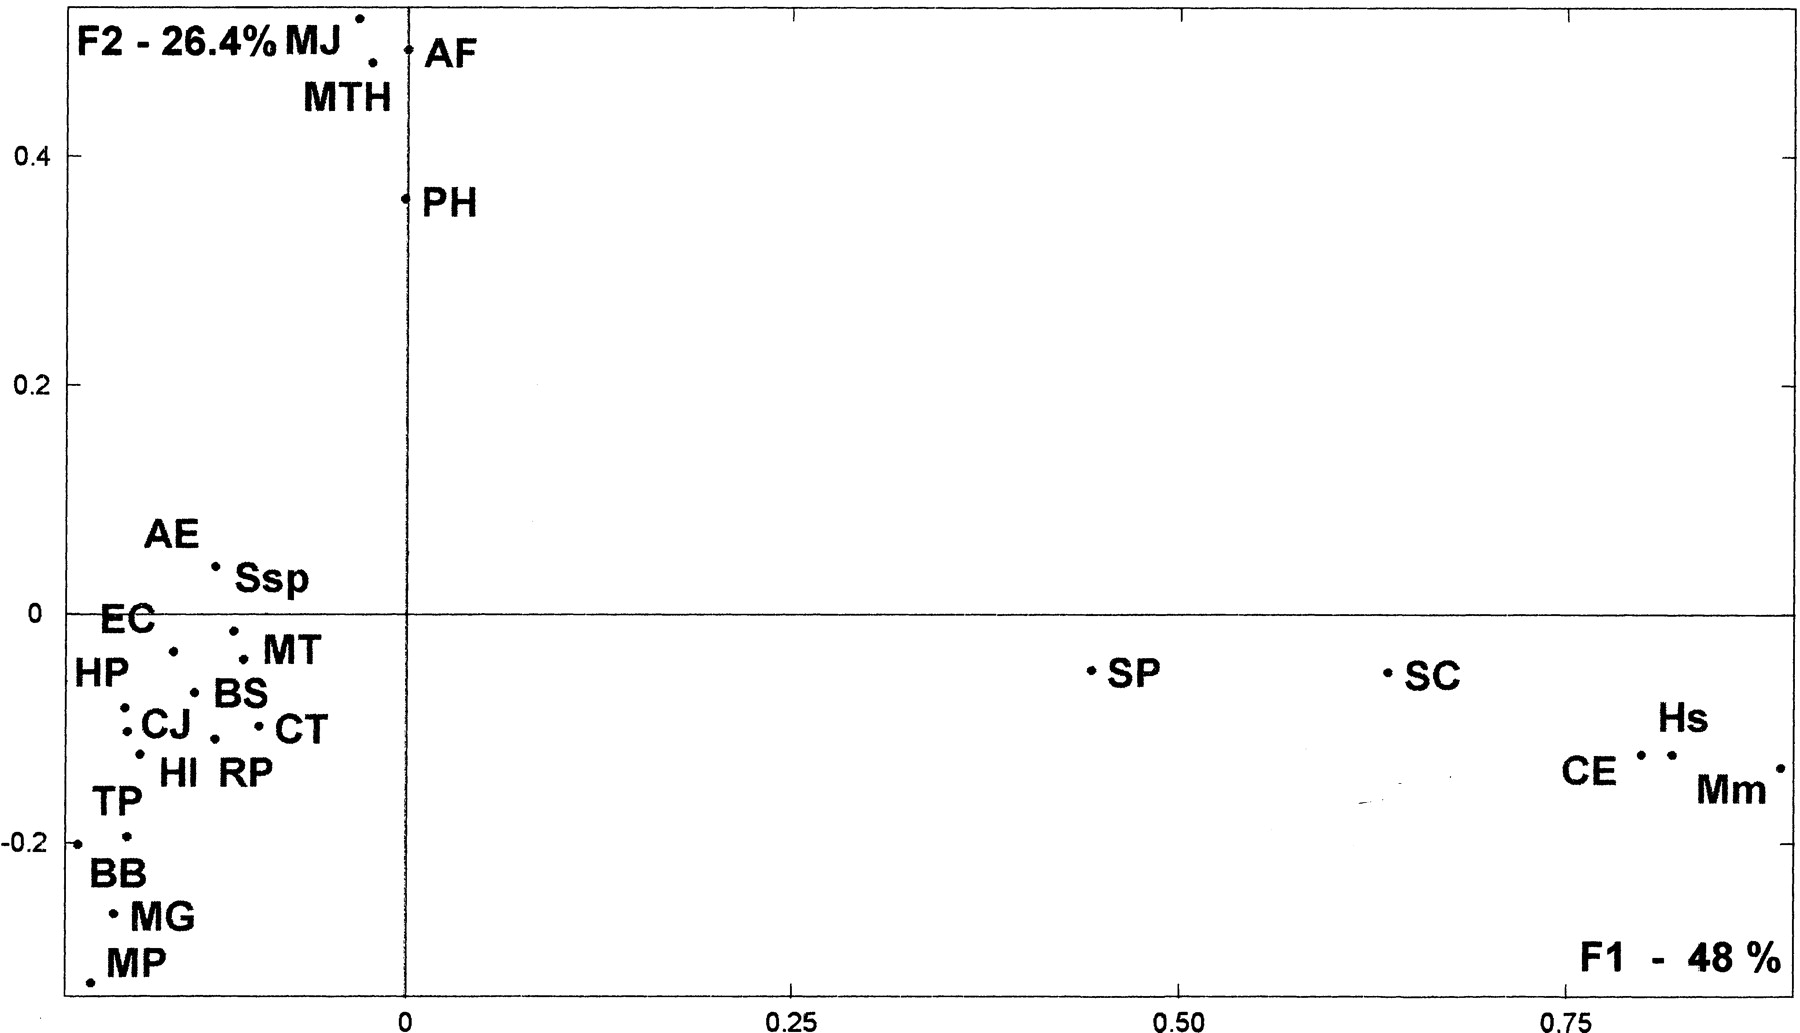
Figure 1.
Factorial representation of the weight of ancestral duplication and common ancestry in each genome, obtained by the multidimensional correspondence analysis method. First and second factorial axes (F1 and F2) represent, respectively, 48% and 26.4% of total information included in the ancestry weight matrix resulting from predicted gene product comparisons (see Methods). Dots represent the distribution of the surveyed organisms (abbreviations are as in Table 1).


