
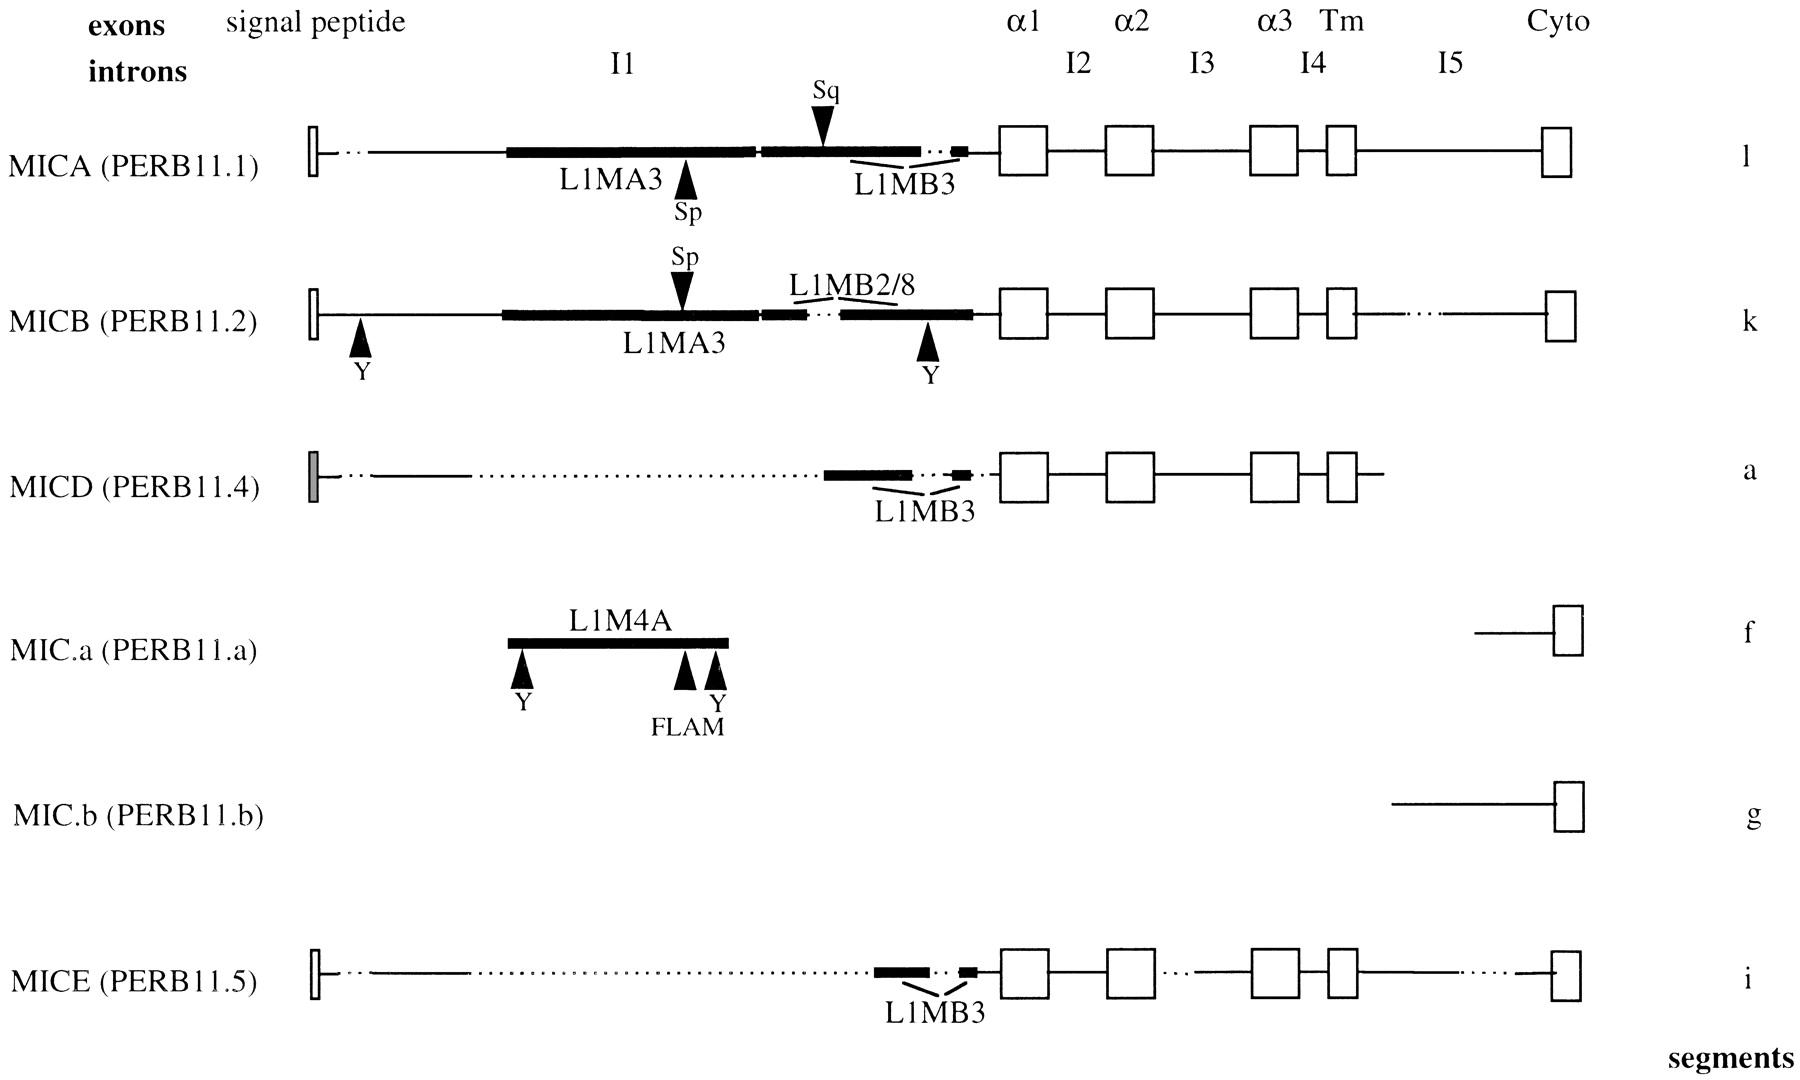
Indels/rearrangements within MIC (PERB11) members. A schematic diagram of the MIC (PERB11) gene family. The intron and exon structure is depicted on MICA (PERB11.1). Exons are shown as open boxes and labeled as signal peptide, α1, α2, α3, Tm (transmembrane region), and cyto (cytoplasmic region). The introns are shown as lines and labeled in order as I1–I5. The positions of gaps in MIC (PERB11) members are indicated by a dashed line. L1 sequences are depicted by solid bars. The positions of Alu sequences are shown by arrowheads. The signal peptide of MICD (PERB11.4) is shown by a grey box, as the level of identity with other members is low in this region and the corresponding open reading frame does not encode hydrophobic amino acids as found in the signal peptide of other members. MICA (PERB11.1) andMICB (PERB11.2) are full-length genes transcribed in the beta block. MICD (PERB11.4) and MICE (PERB11.5) are pseudogenes, and MIC.a (PERB11.a) and MIC.b (PERB11.b) are fragments containing the 3′ end of the gene.


