
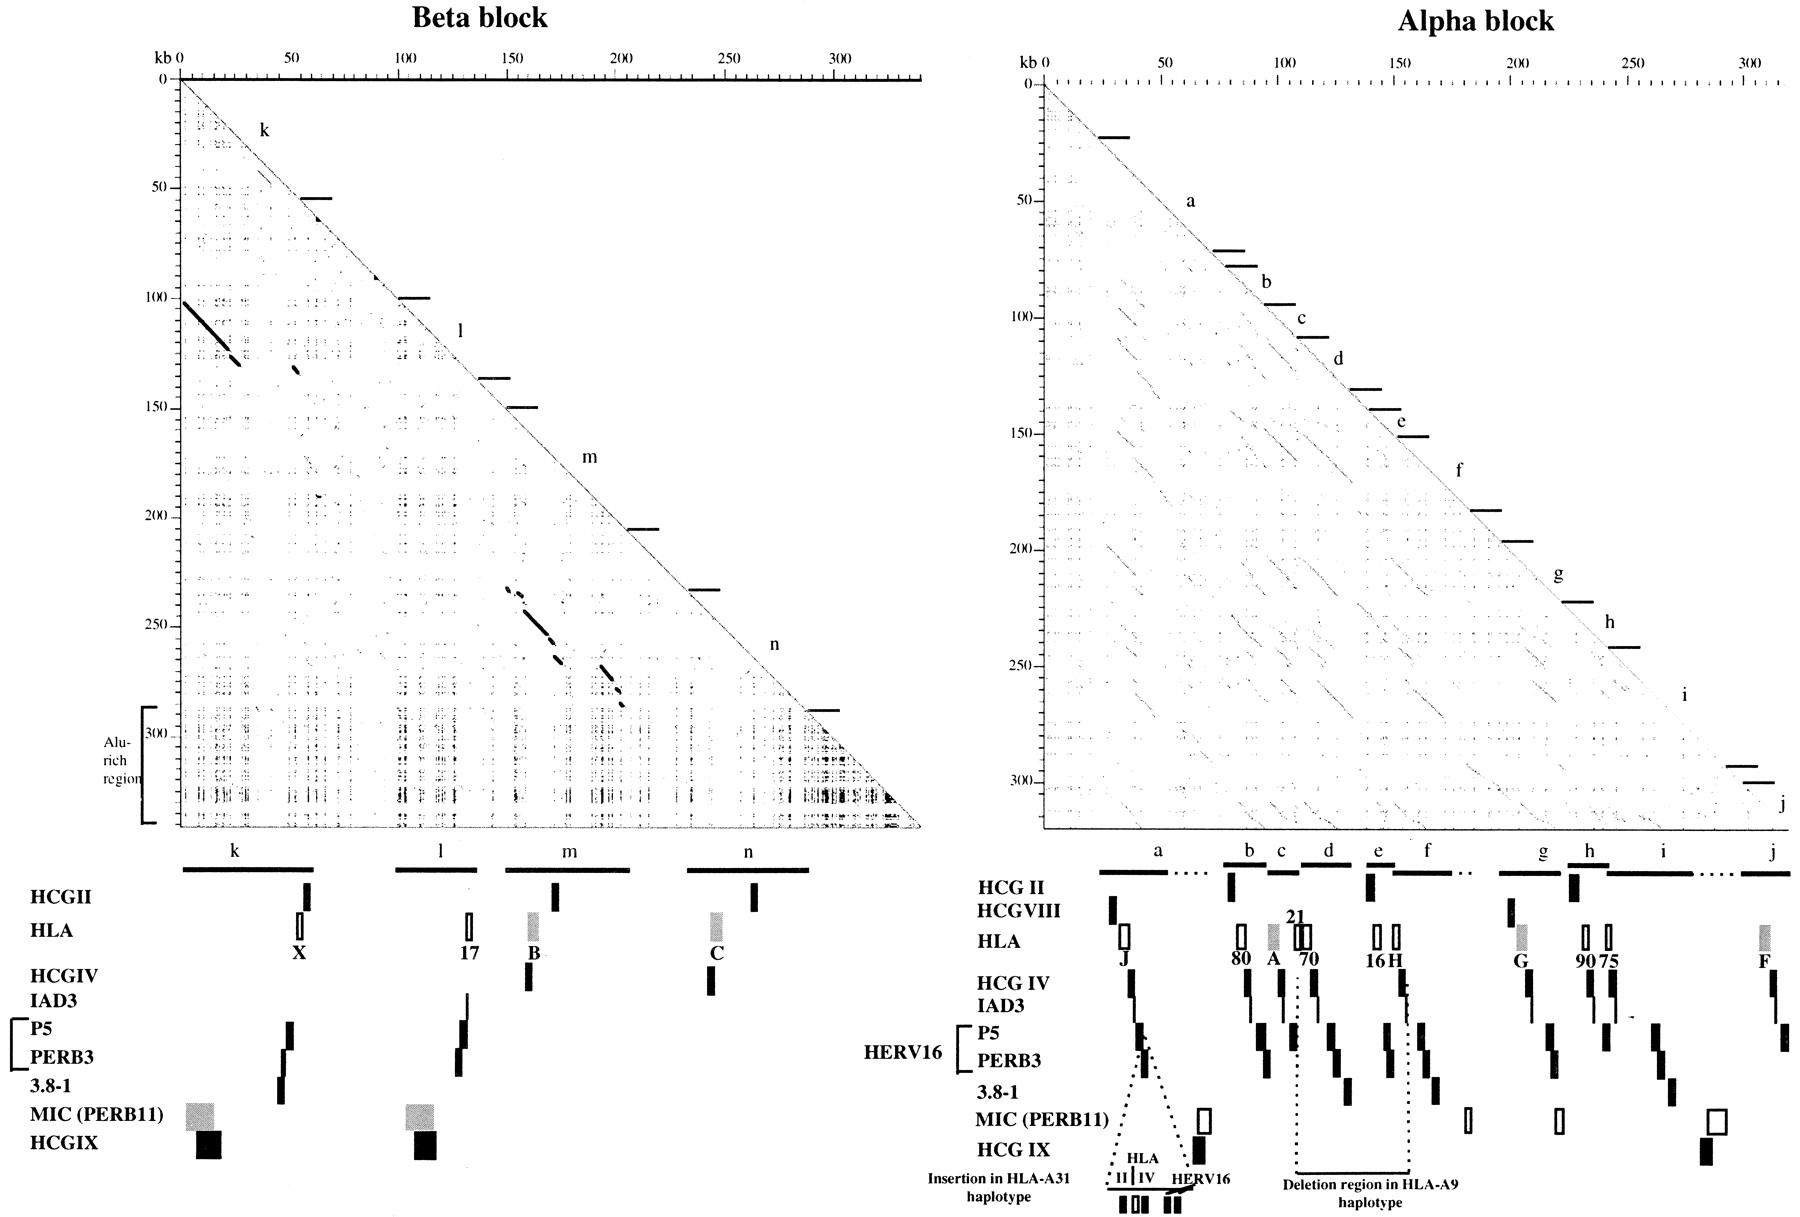
Segmental duplication of linked multicopy gene families. Dot-plot analysis of the intracomparison of the alpha (right) and beta (left) blocks. Diagonal lines within the dot plots indicate regions of duplication, with interruptions corresponding to indels. The position of the multicopy gene families HLA class I, HCG (II, IV, VIII, and IX), 1AD3, P5 + PERB3 (HERV-16), 3.8-1, and MIC (PERB11) are shown below the x-axis. Based on the duplication end points in the dot plot and the ordering of the multicopy gene families, duplicated segments have been designated a–n. In the alpha block, there is minimal distance between duplicated segments indicating that the duplication of the MIC (PERB11) members may have involved, though less likely, a neighboring segment. For the well-characterized HLA class I and MIC (PERB11) members, transcribed genes are indicated by shaded boxes, and pseudogenes and gene fragments are shown by open boxes. The HCG, 1AD3, and HERV-16 families are shown by black boxes. The endpoints of the human haplotype indels are indicated by horizontal dashed lines. Segment j is truncated at the 3′ end following anAlu Ya5/8 insert coinciding with the end of the alpha block sequence (accession no. AF055066). An Alu-rich region in the beta block is indicated.


