
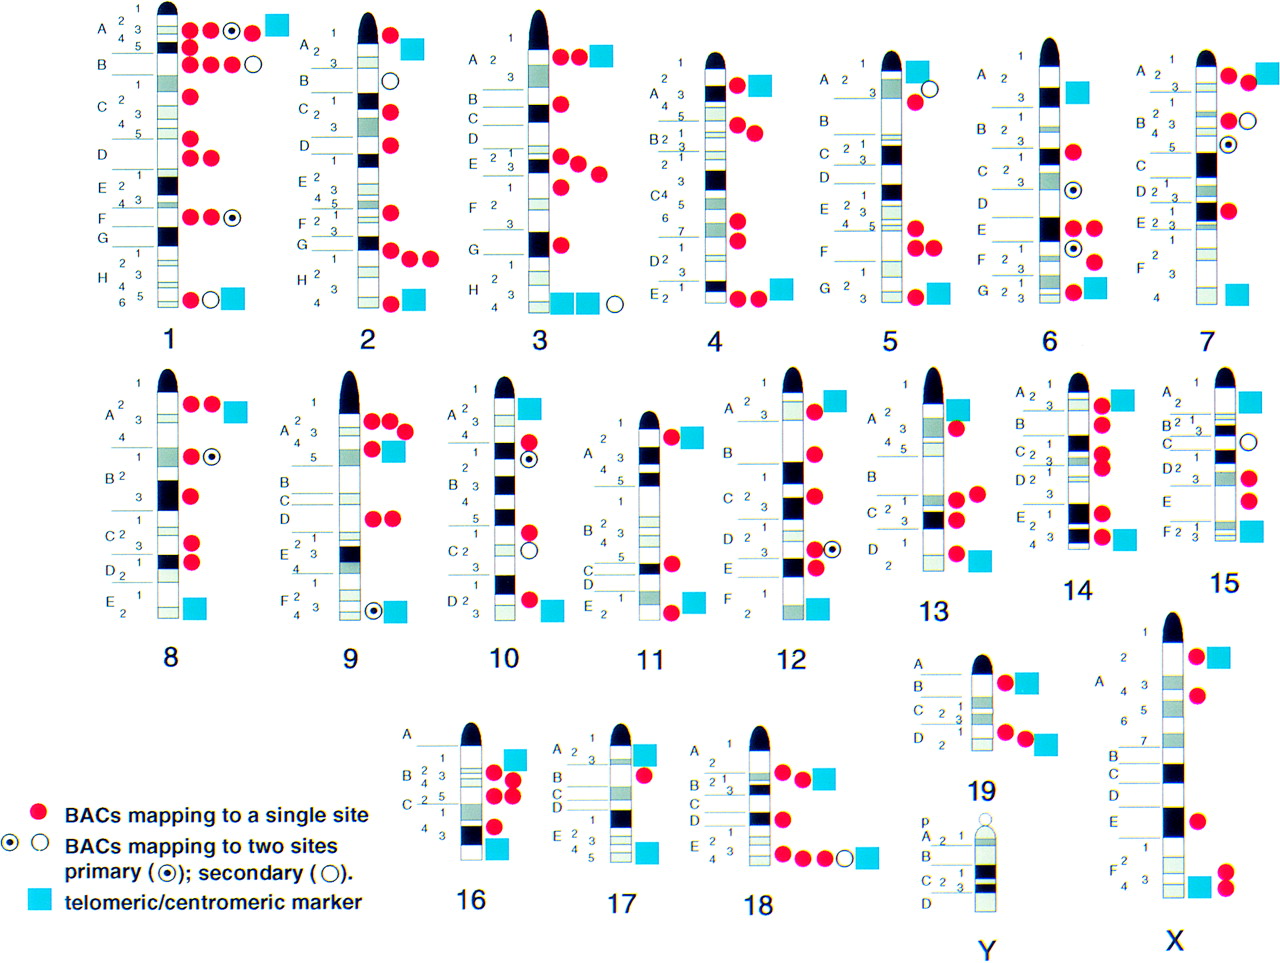
Figure 4.
Ideogram of the integrated BAC resource for mouse cytogenetics. The locations of the 157 FISH-mapped BACs are shown relative to the fluorescent R-banded mouse chromosomes. Those clones containing centromeric and telomeric genetic markers are represented by blue boxes; clones mapped at random and clones containing markers from the chromosome arms are represented as red circles. Clones with two sites of hybridization are represented as target circles for the primary signal and open circles for the secondary signal.


