
Figure 5.
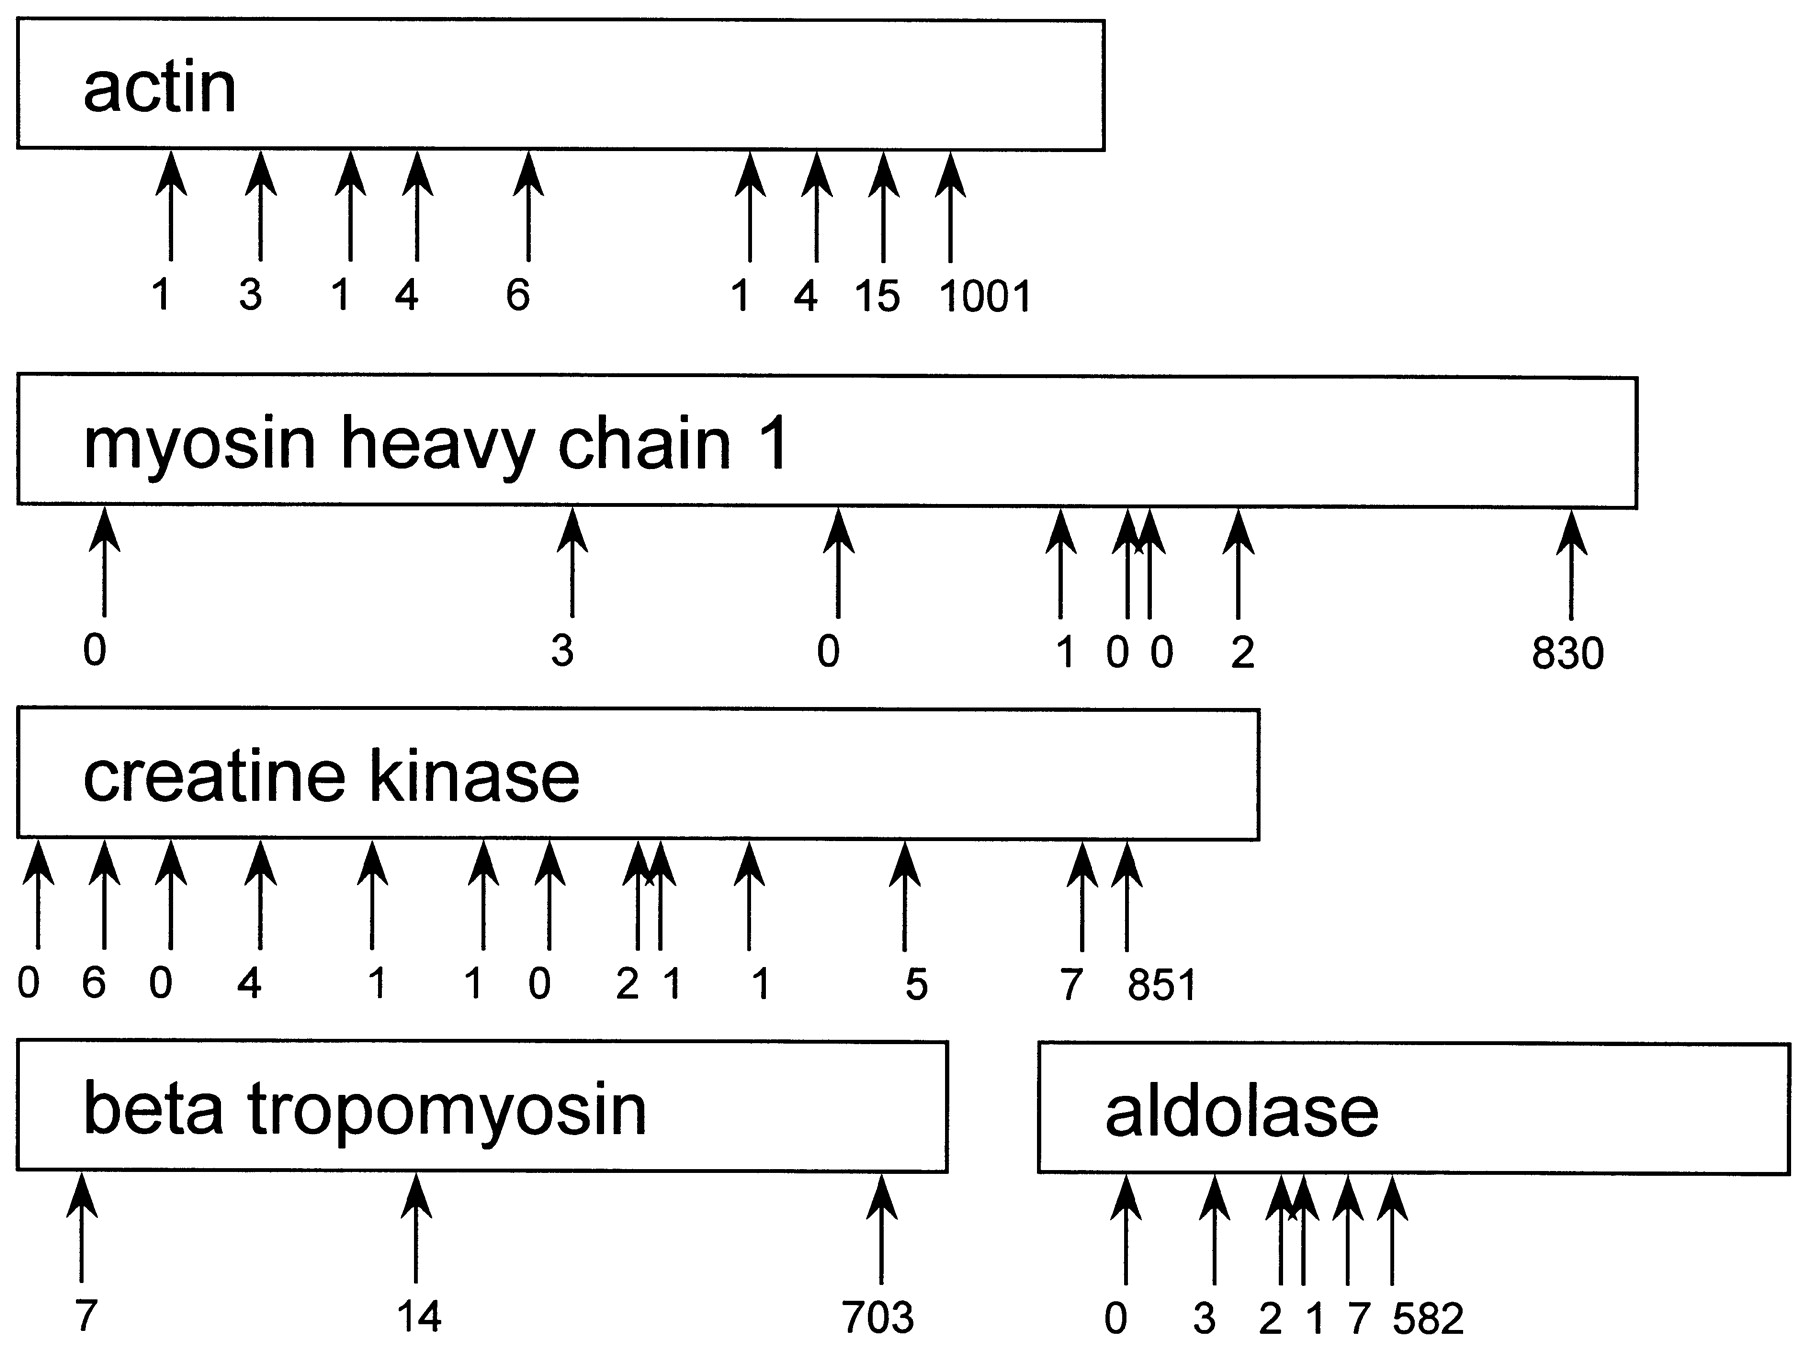
Map of the NlaIII restriction sites in some of the most abundant nonmitochondrial cDNAs, and abundances of the SAGE tags corresponding to each of these sites.
(Downloading may take up to 30 seconds. If the slide opens in your browser, select File -> Save As to save it.)
Click on image to view larger version.
Map of the NlaIII restriction sites in some of the most abundant nonmitochondrial cDNAs, and abundances of the SAGE tags corresponding to each of these sites.
 CiteULike
 Delicious
 Digg
Digg Facebook
 Google+
 Reddit
 Twitter
