
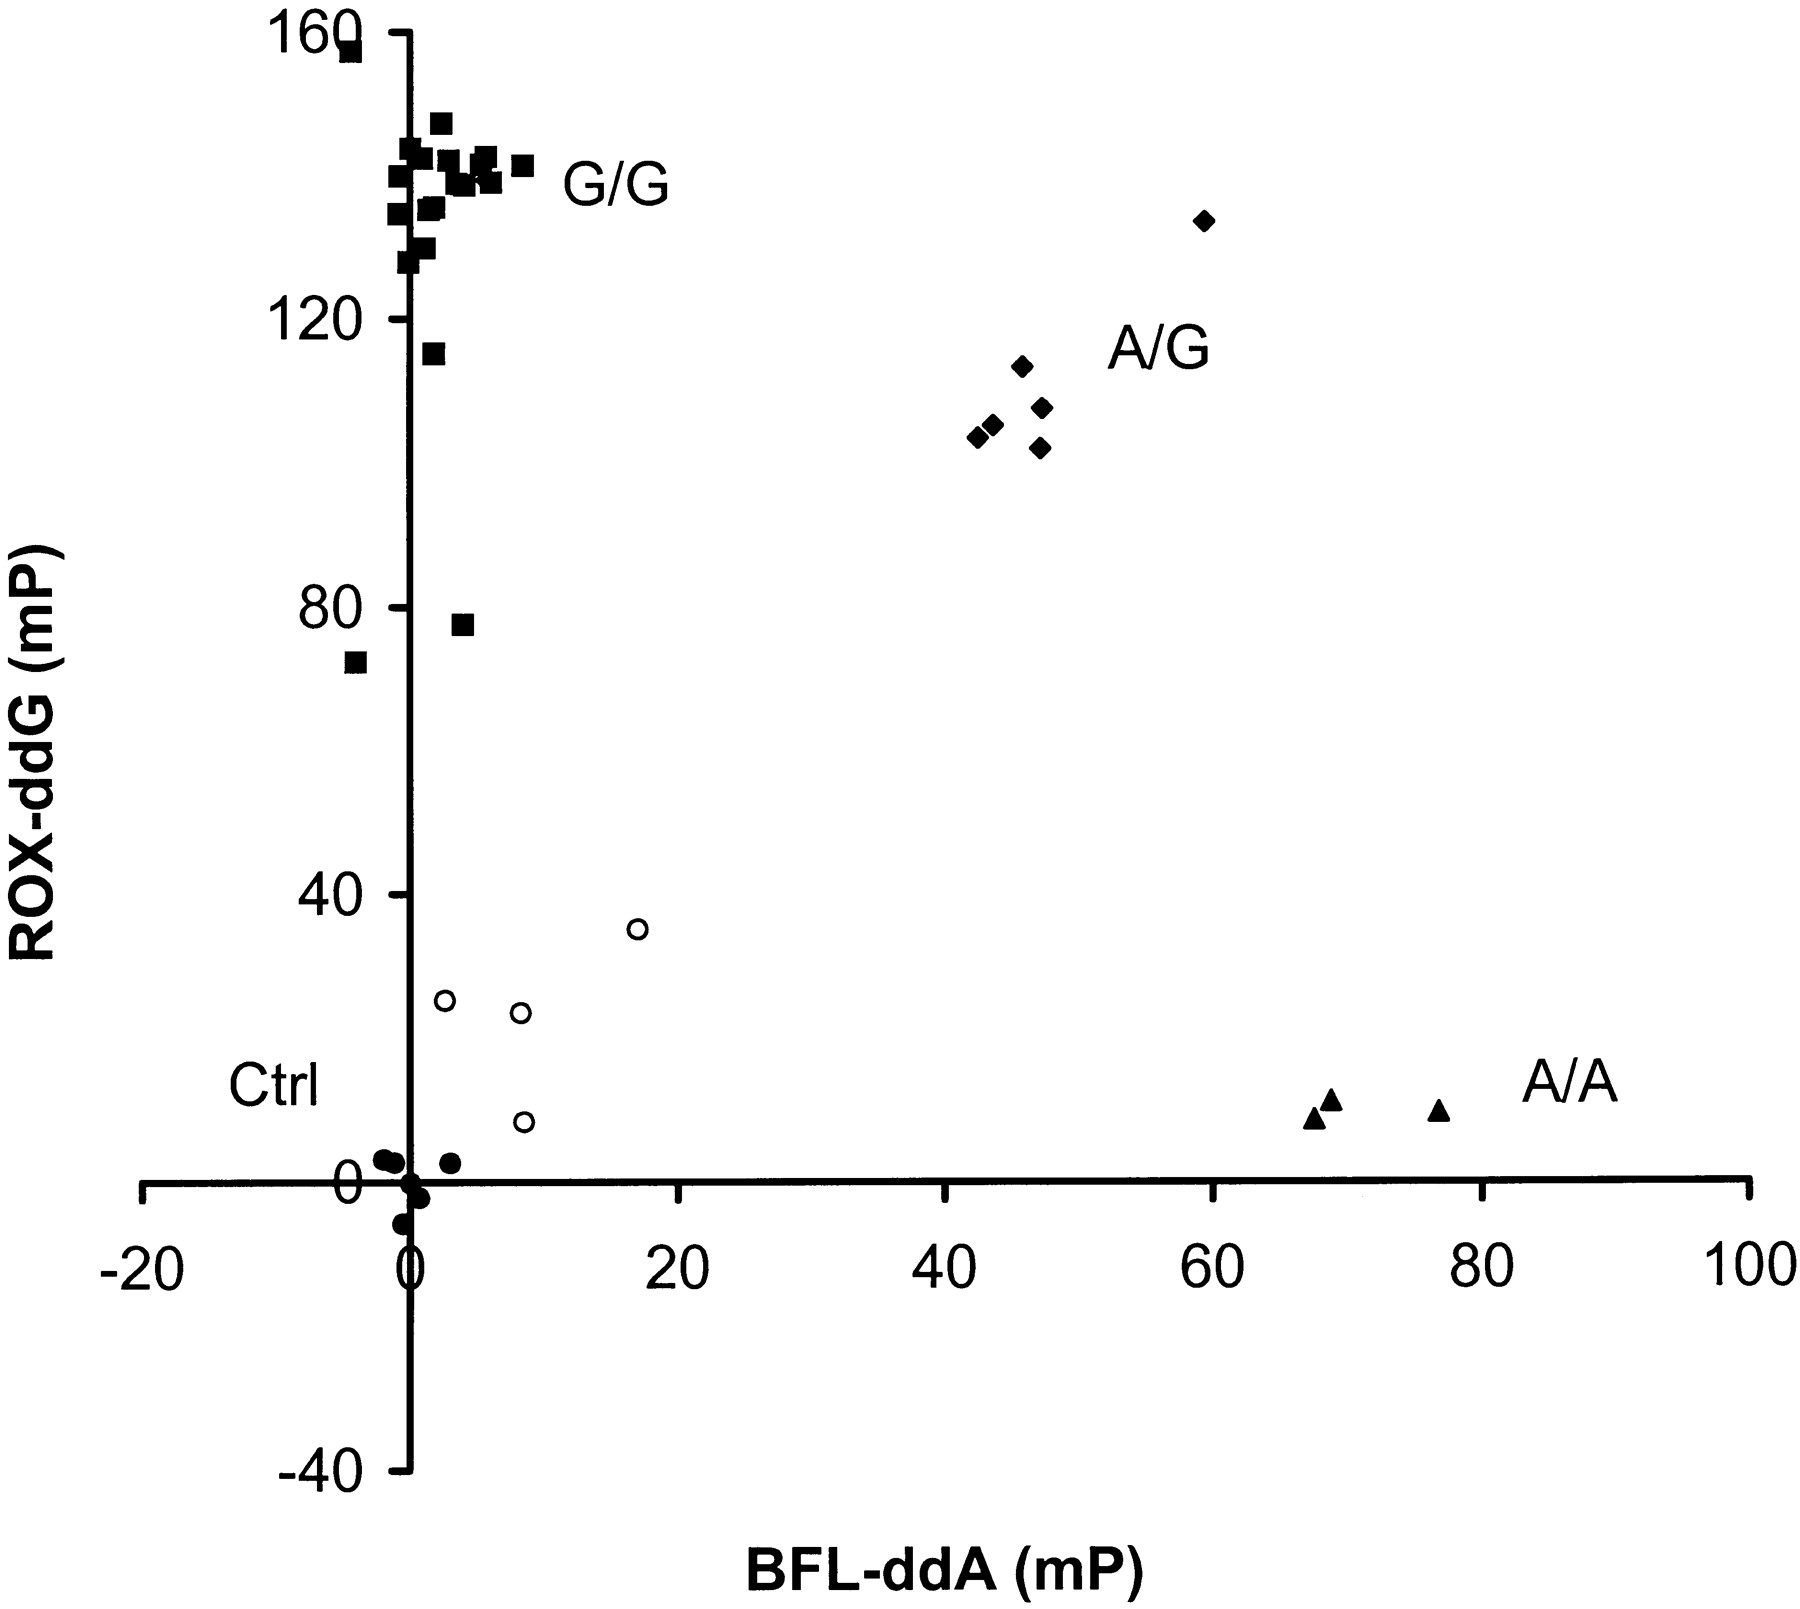
Changes in fluorescence polarization for DNA samples genotyped with the FP–TDI assay. The results are plotted in mP units above the average polarization of the negative controls. A change of 40 mP for a dye-terminator is scored as positive. DNA samples from 34 individuals and 6 water blanks were used. (◼) Samples positive for the G allele but negative for the A allele (homozygous G); (▴) samples positive for the A allele but negative for the G allele (homozygous A); (♦) samples positive for both alleles (heterozygotes); (●) negative controls; (○) samples with failed PCR amplification. Numerical values for the data are available as online supplementary material athttp://www.genome.org.


