
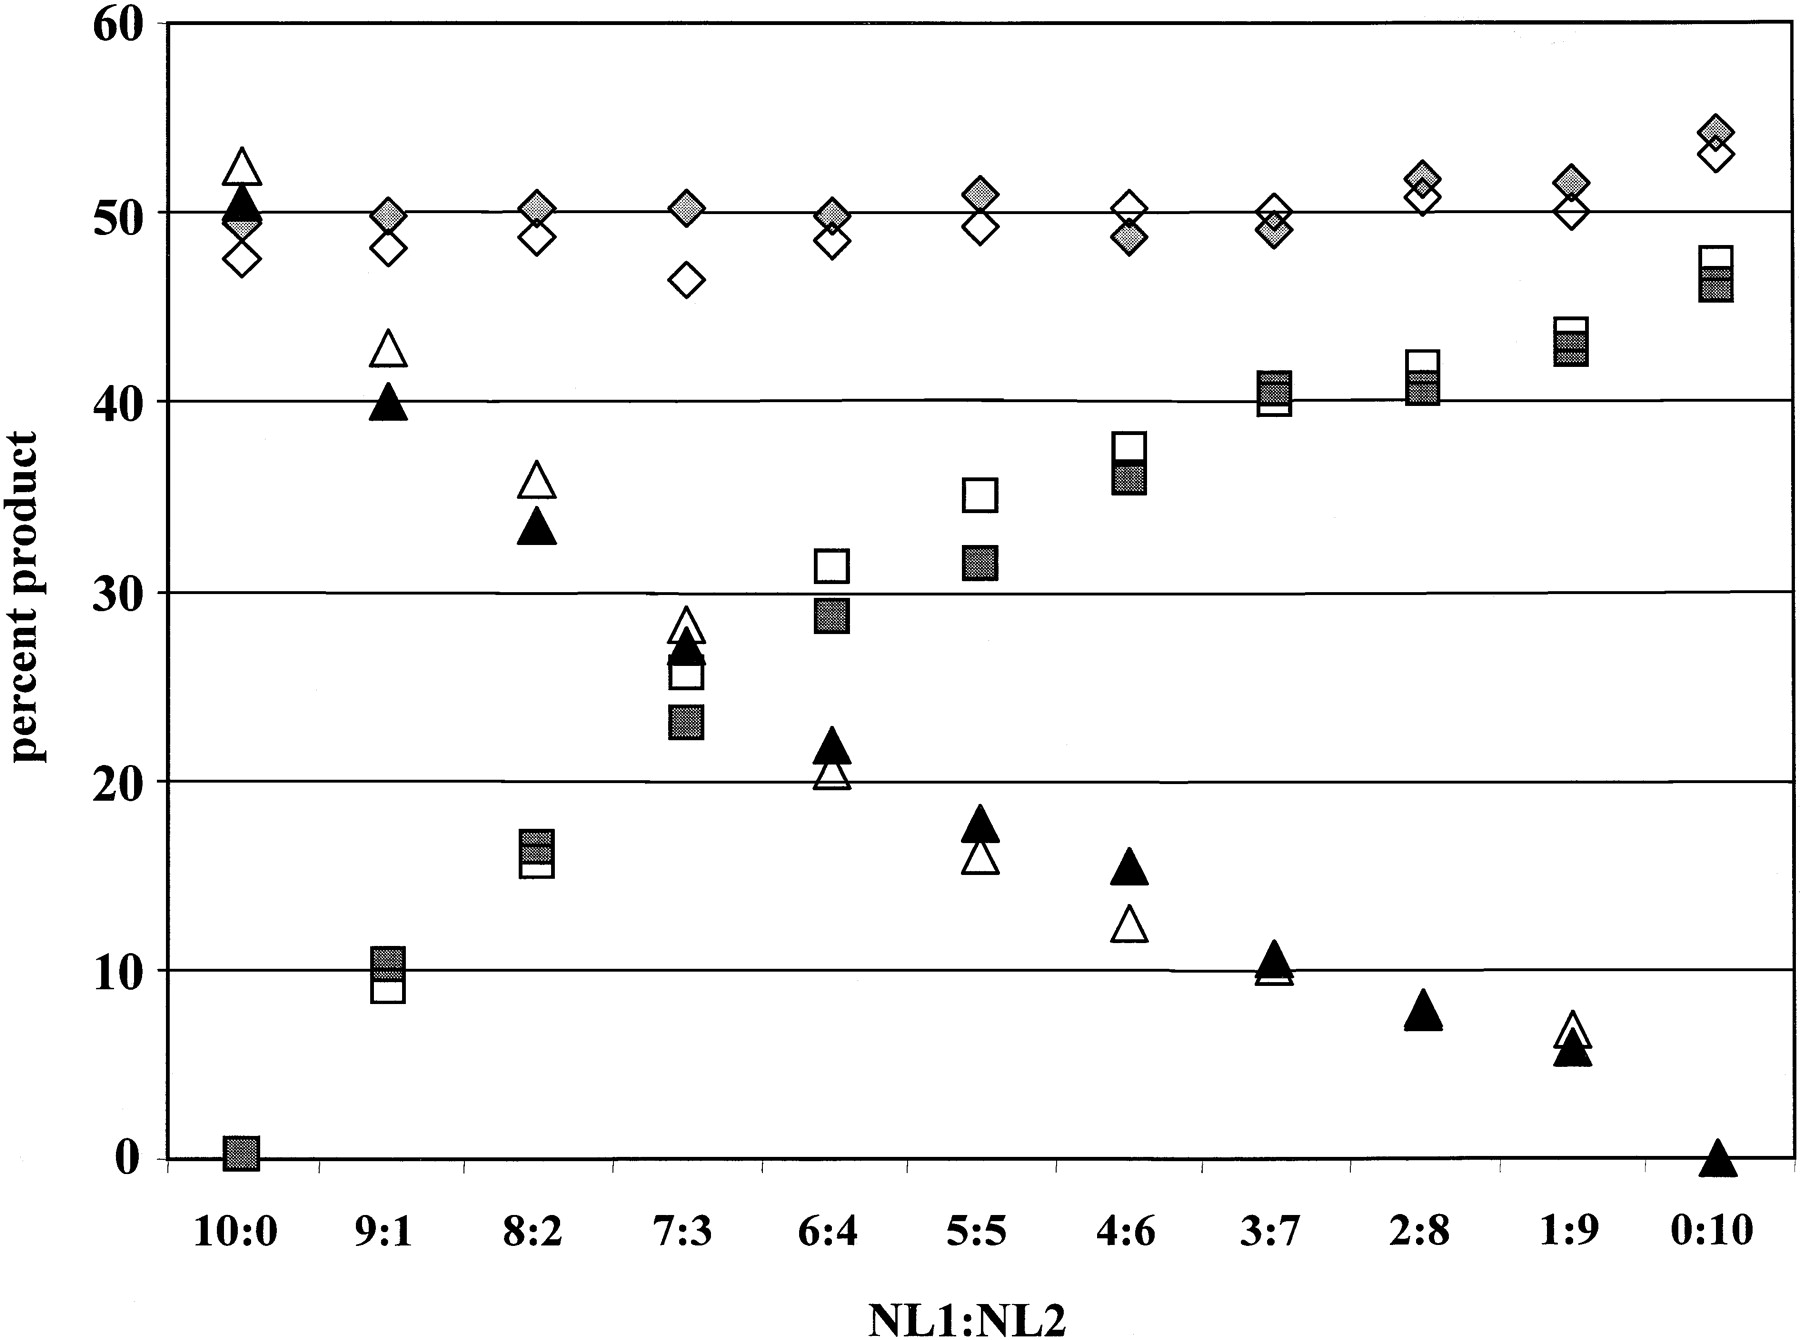
PEP preserves relative allele concentrations. Two cases were selected that were informative at the chromosome 17 STR D17S1303, and that had one common allele (diamonds) of the same size (bp), and one unique allele of different size [NL1 (triangles) or NL2 (squares) allele]. Locus-specific reactions were performed with either genomic DNA from the equivalent of 3000 cells (open symbols) or pools of three independent PEP reactions (1000 cells into each PEP) (solid symbols). DNA was mixed with the indicated proportions of NL1:NL2 prior to PEP or locus-specific genomic PCR. The percentage of PCR product represented by each allele was determined by dividing the fluorescent intensity of the allele by the total fluorescent units for all three alleles.


