
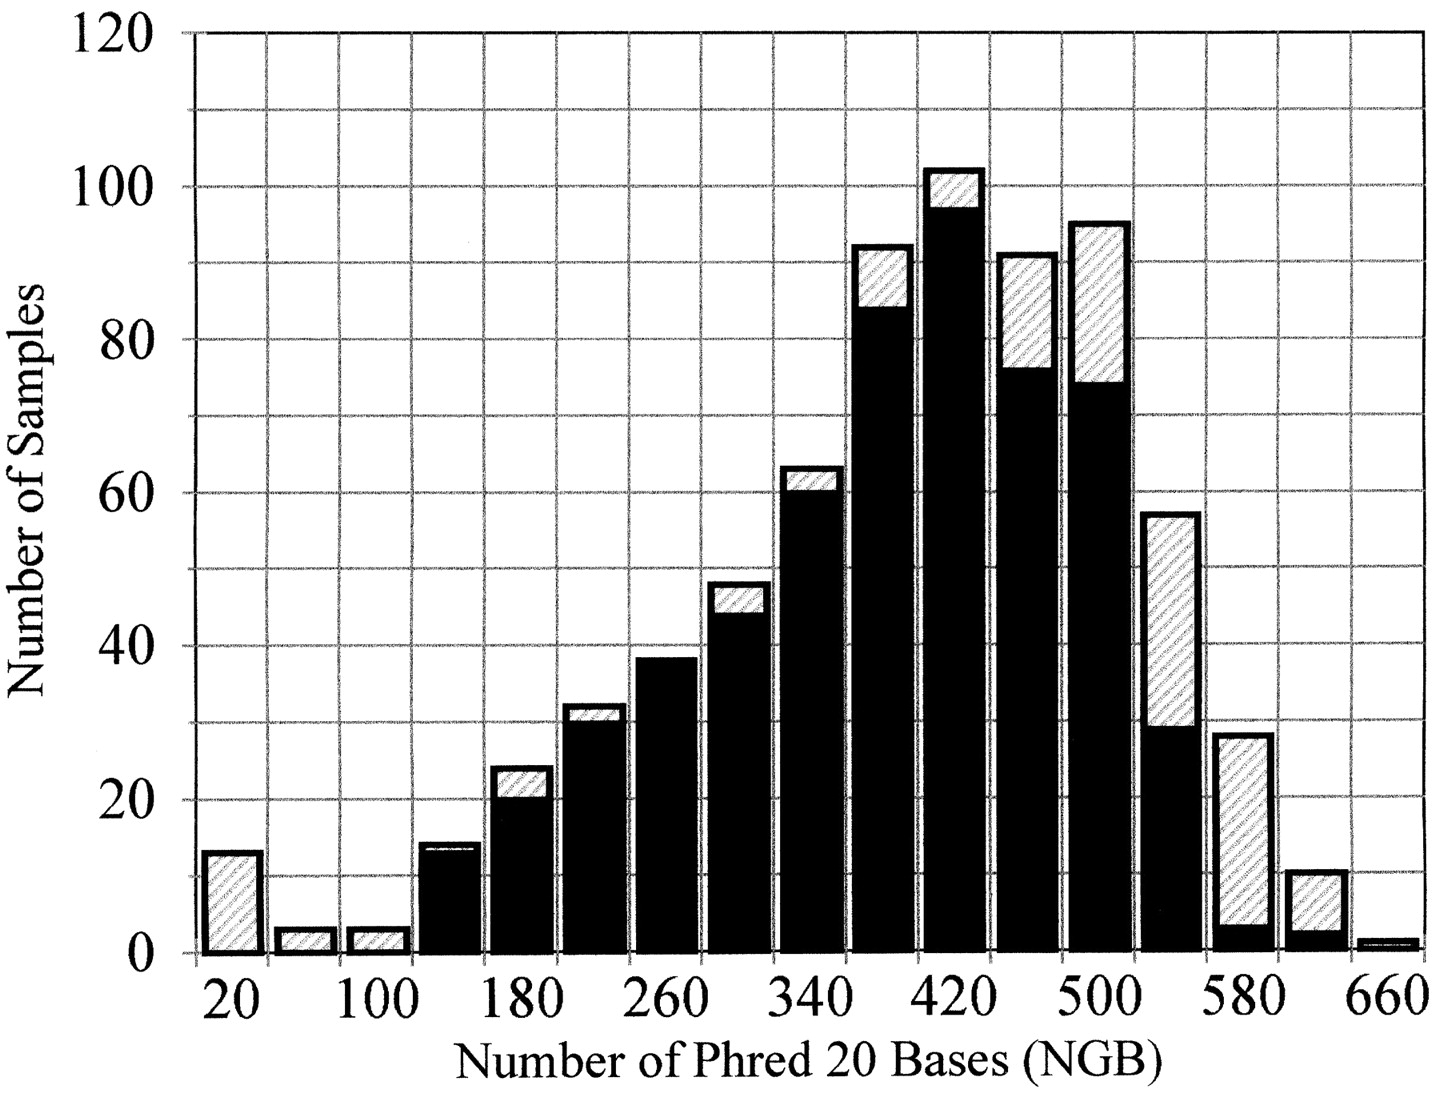
Figure 3.
Histogram of template quality measured by number of Phred bases with quality scores of 20 and higher. The shaded regions correspond to templates resequenced to remove effect of sequencing end failures.


