
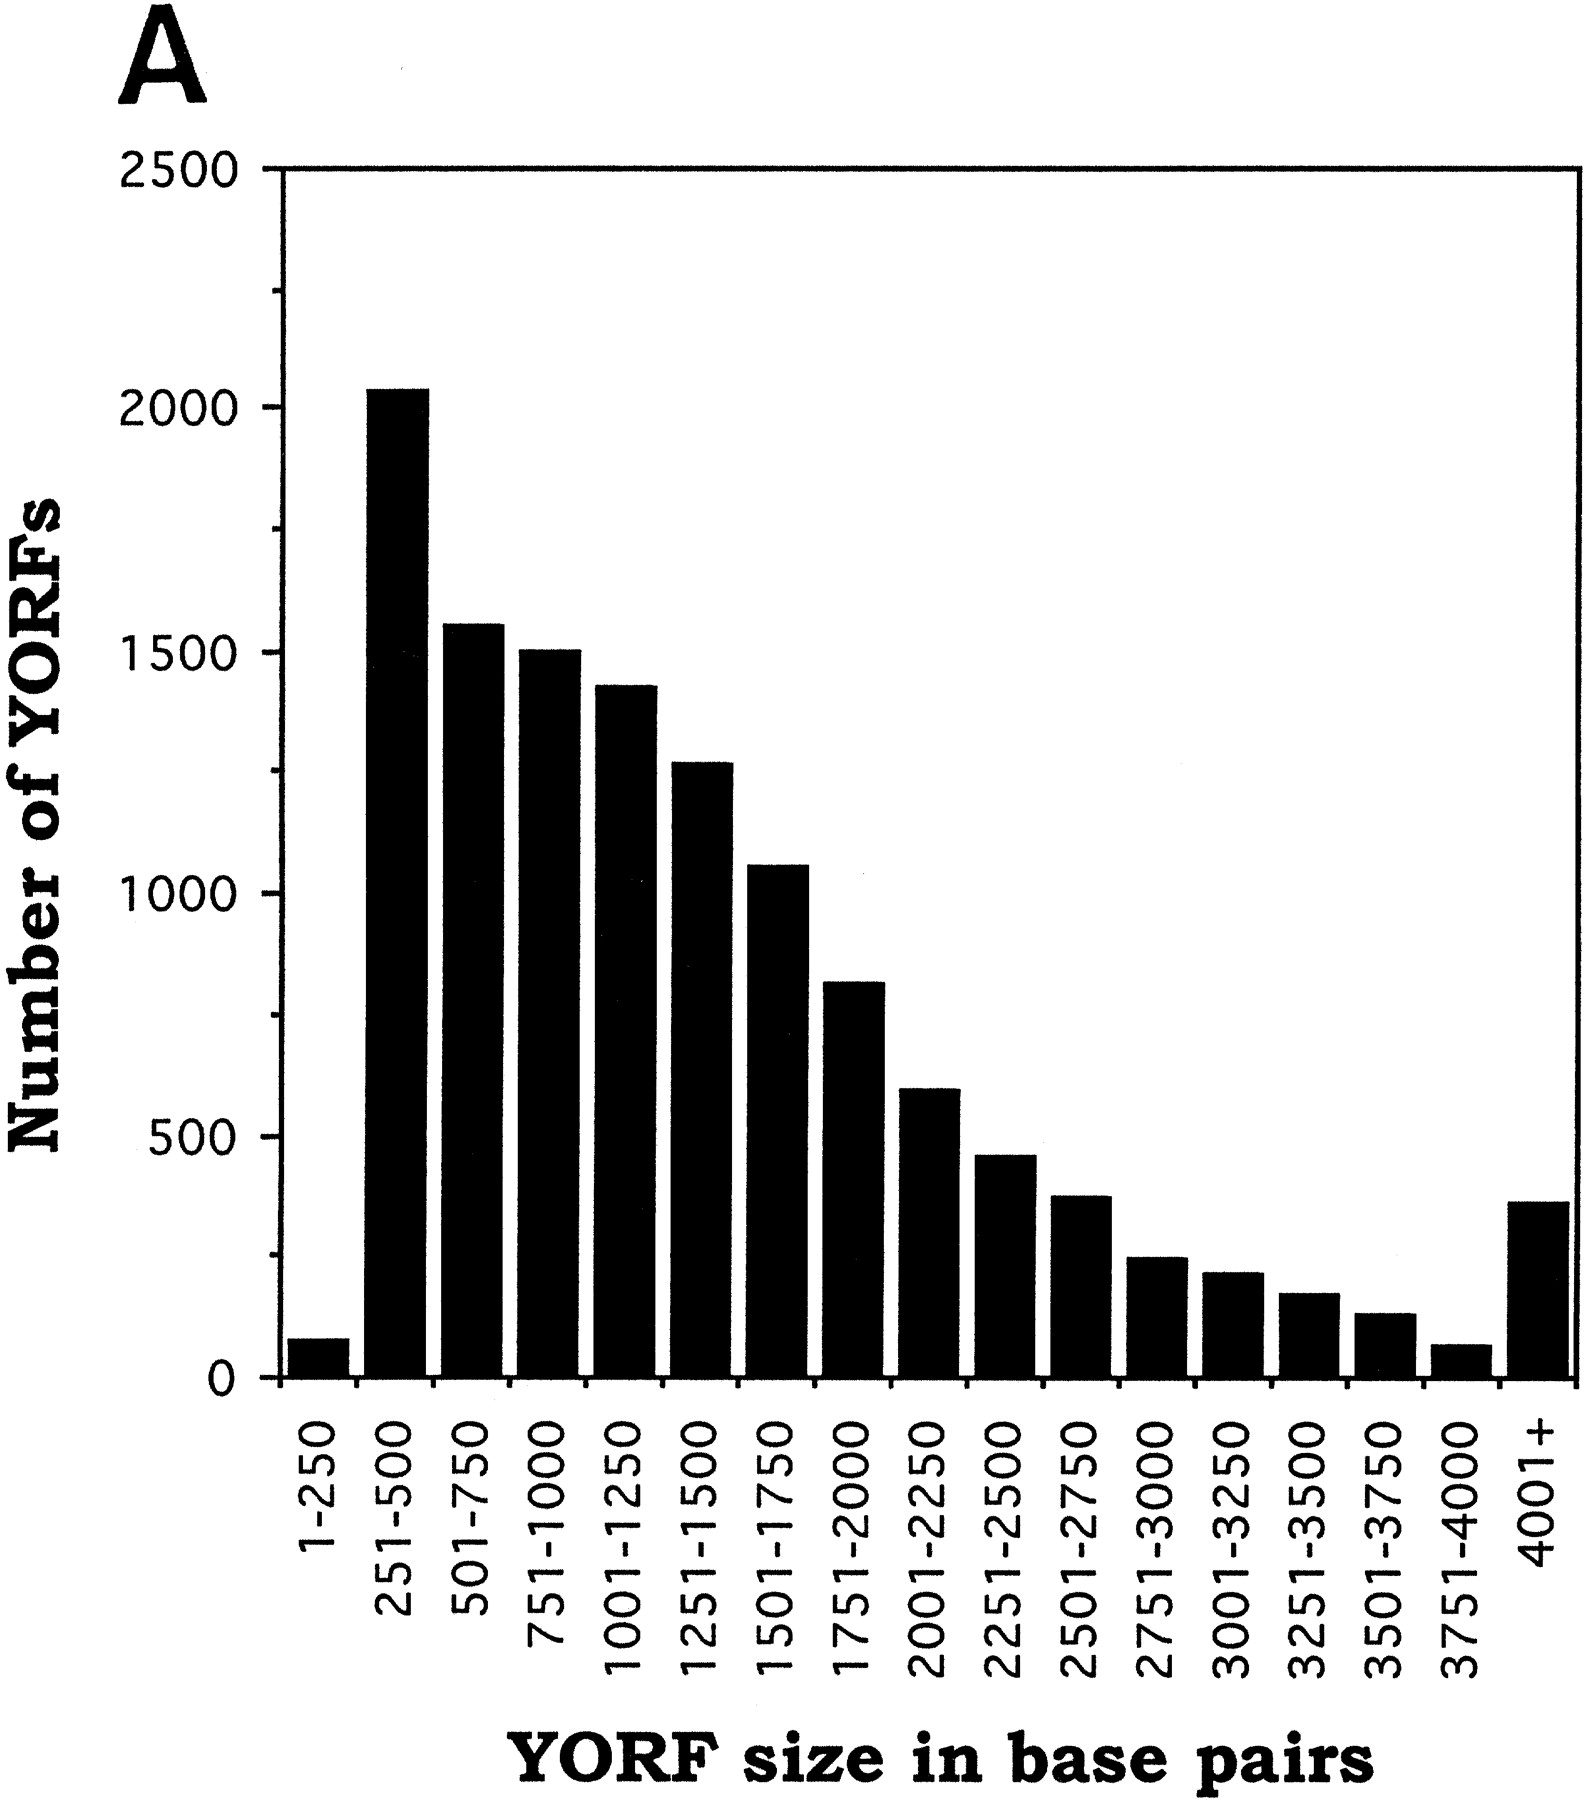
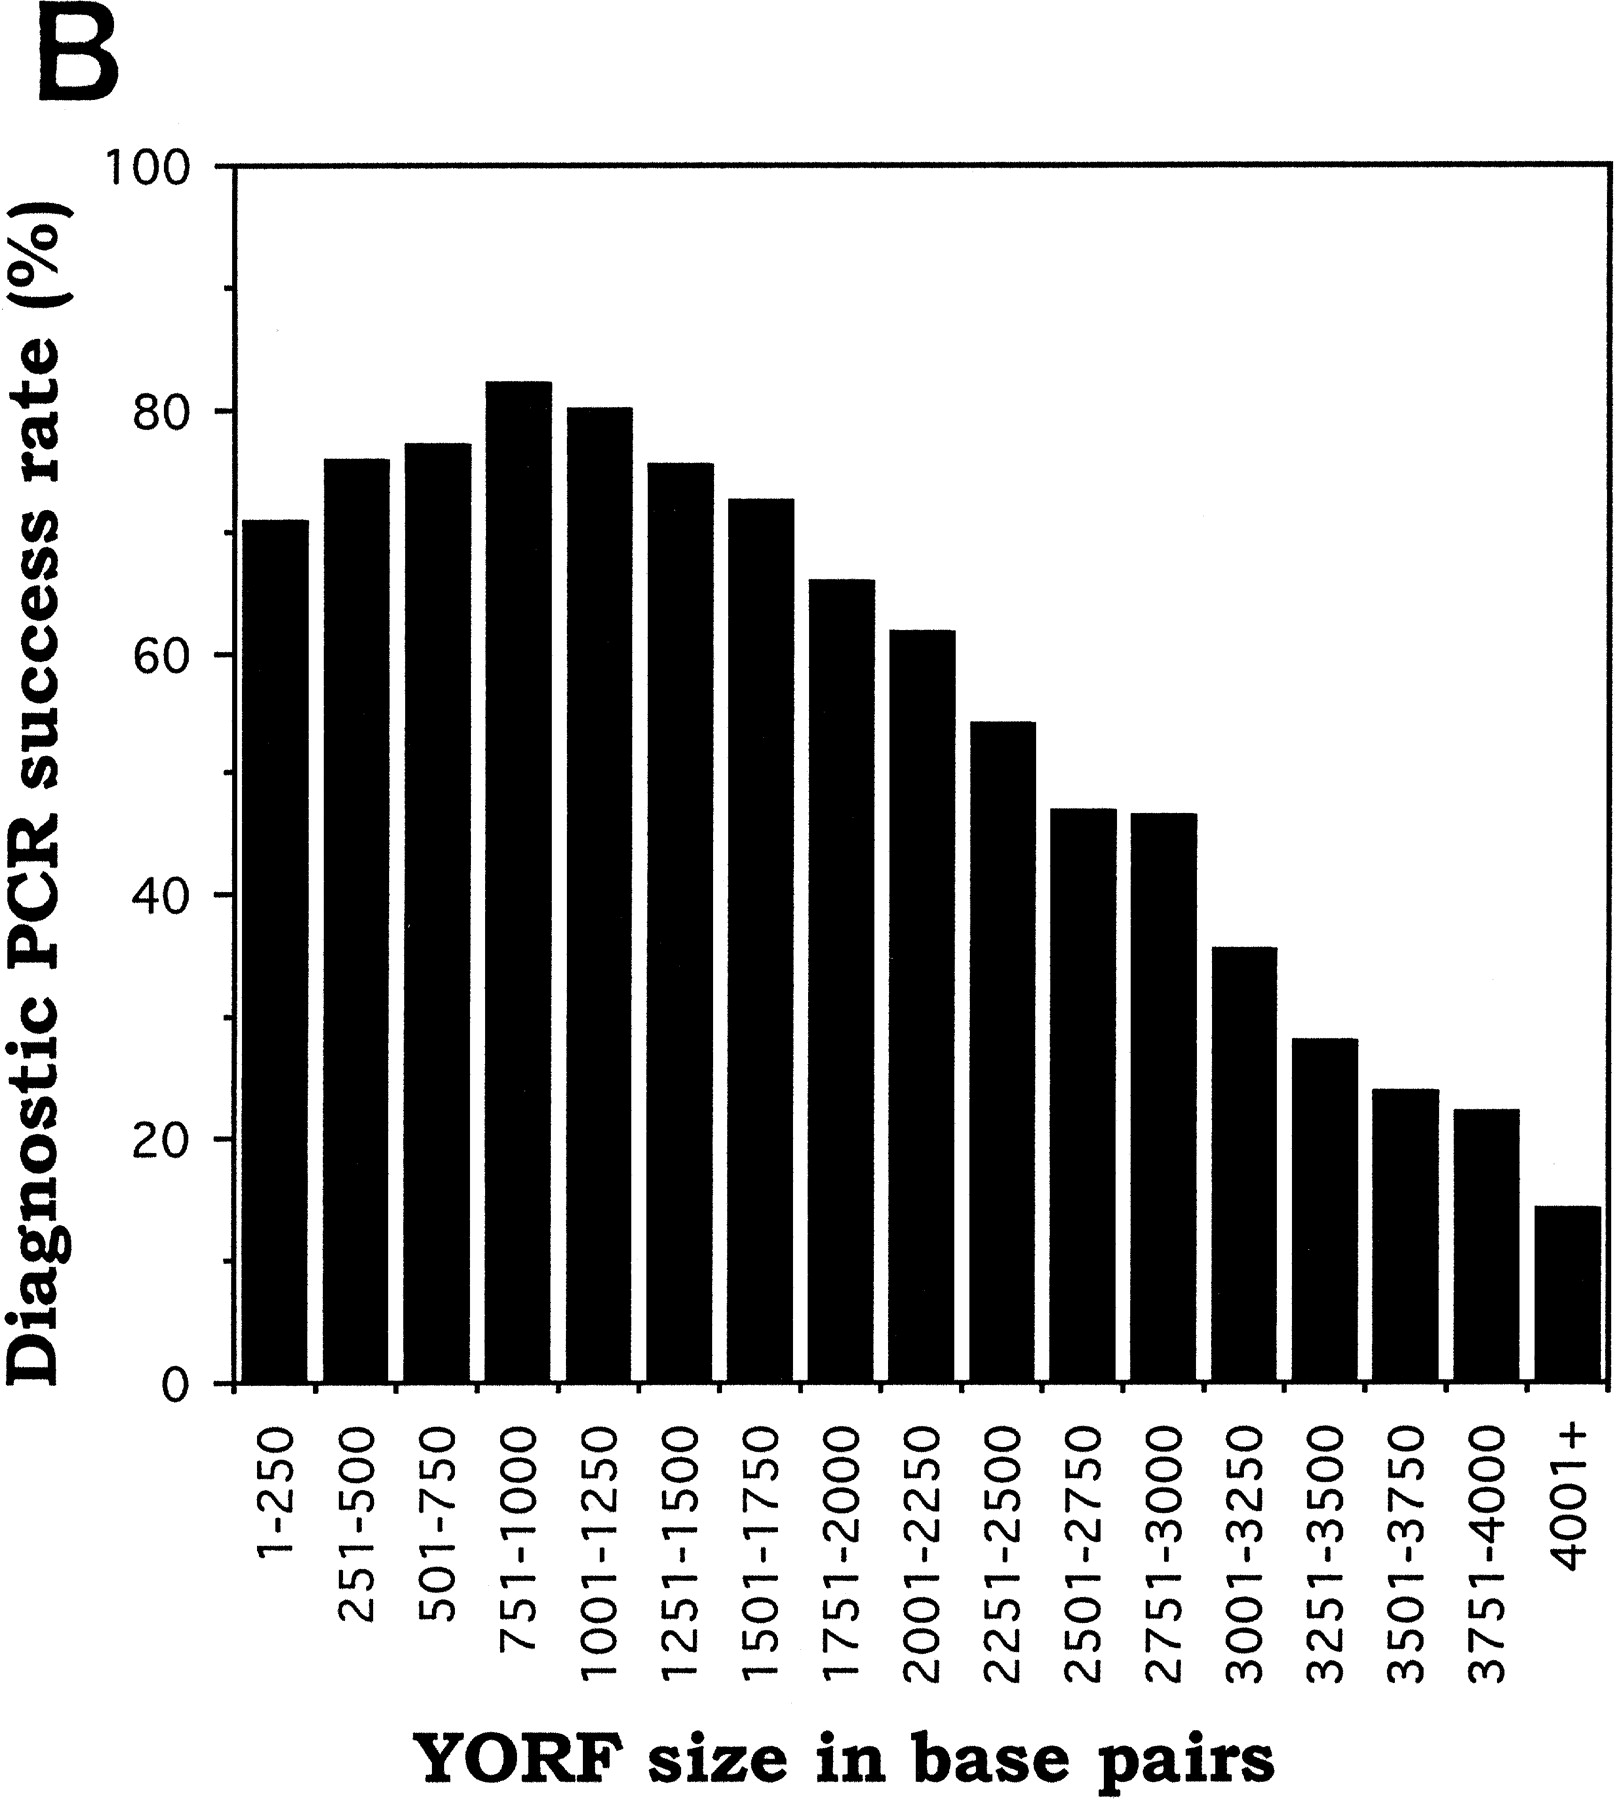
Figure 4.
Correlation between YORF length and success rate of diagnostic PCR (dPCR). (A) YORF PCR products were sorted by size into groups that increase in size by 250 bp increments. (B) The dPCR success rate was obtained, for each group, by dividing the number of YORFs for which dPCR on eight colonies identified ≥1 positive-orientation clones by the total number of YORFs in that size group.


