
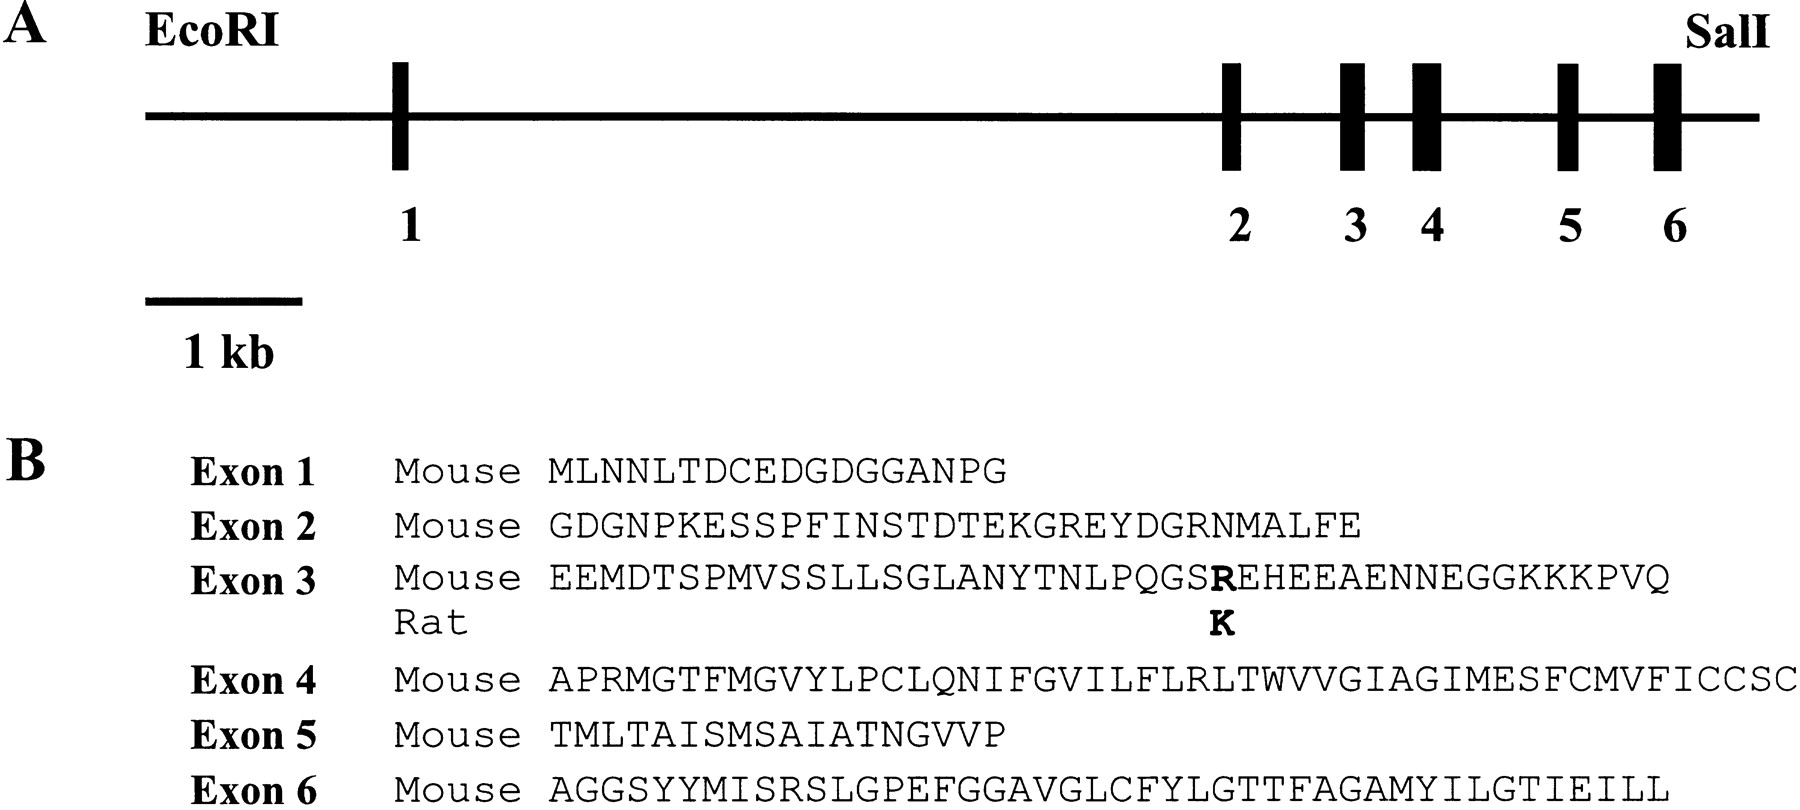
Figure 4.
(A) Exon/intron structure of mouse Kcc2 gene region. (Solid rectangles) Exons. (B). Predicted amino acid sequences encoded by the mouse Kcc2 exons. The only amino acid difference between mouse and rat sequence is shown in boldface type in exon 3.


