
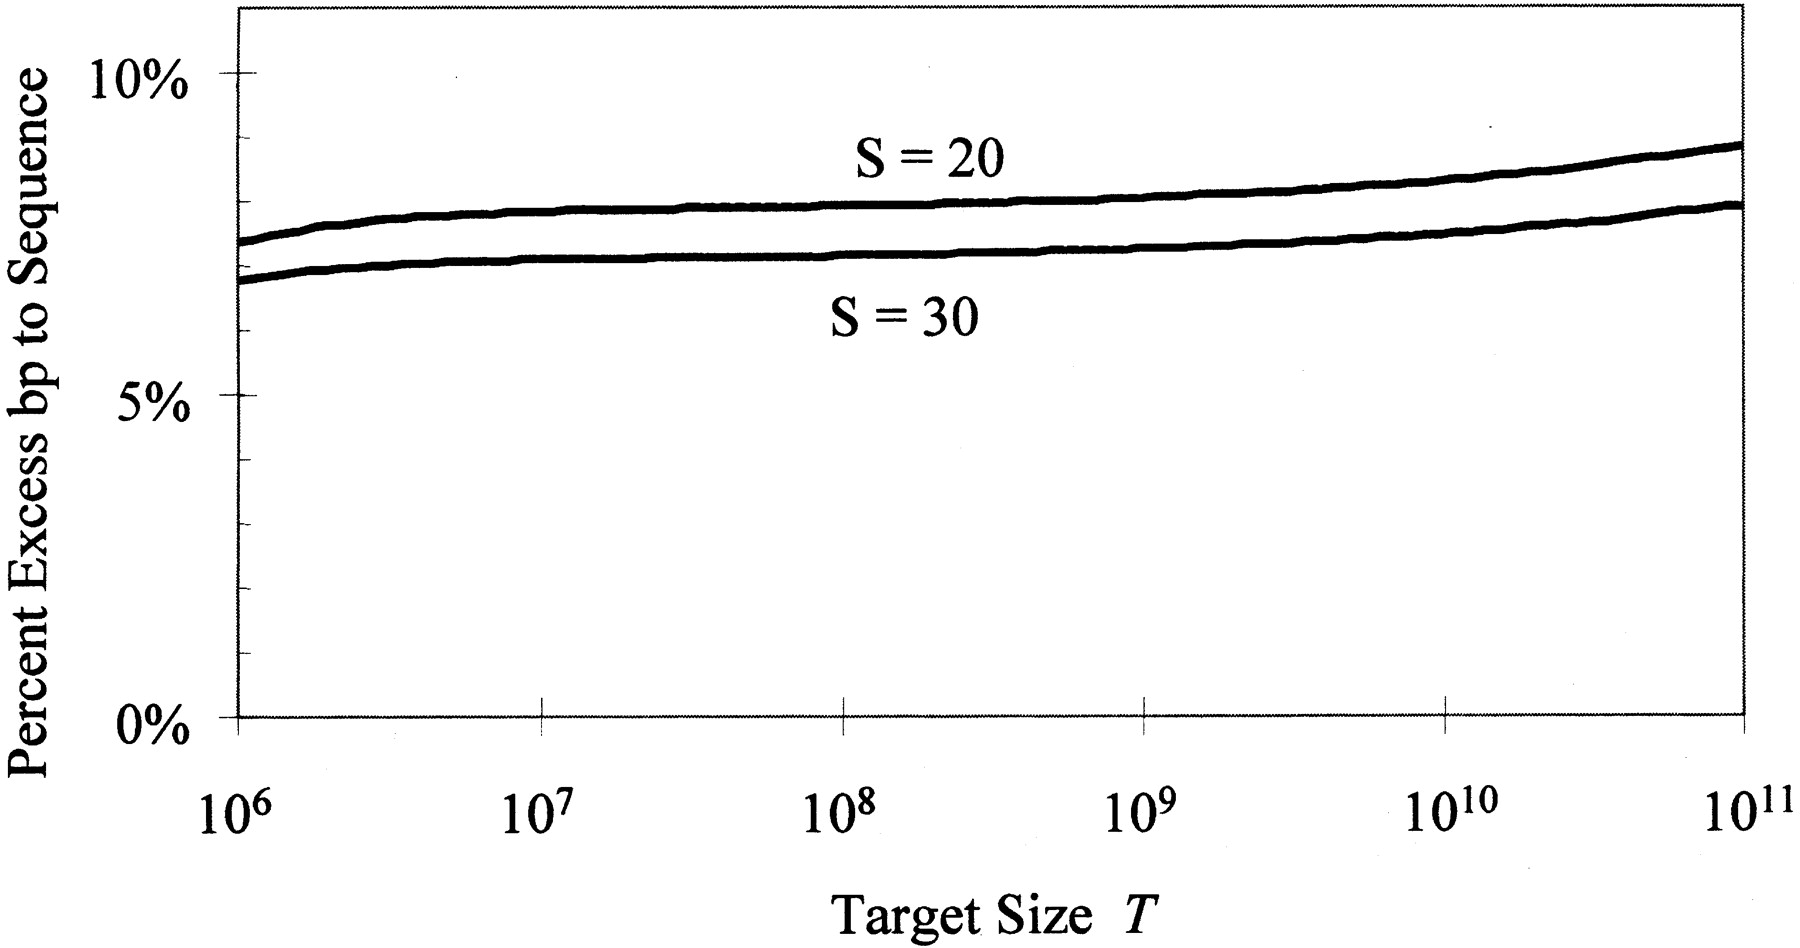
Figure 7.
The “percent excess bp to sequence” compares total cost from the model to the cost of sequencing T/C clones (i.e., sequencing each base of the target at the per-base cost of sequencing an entire clone). The number of repeats in each family has been scaled in proportion to T. This linear scaling is conservative because the smaller microbial genomes contain few repeats and thus can be assembled with fewer problem clones and at lower cost than modeled here.


