
Figure 2.
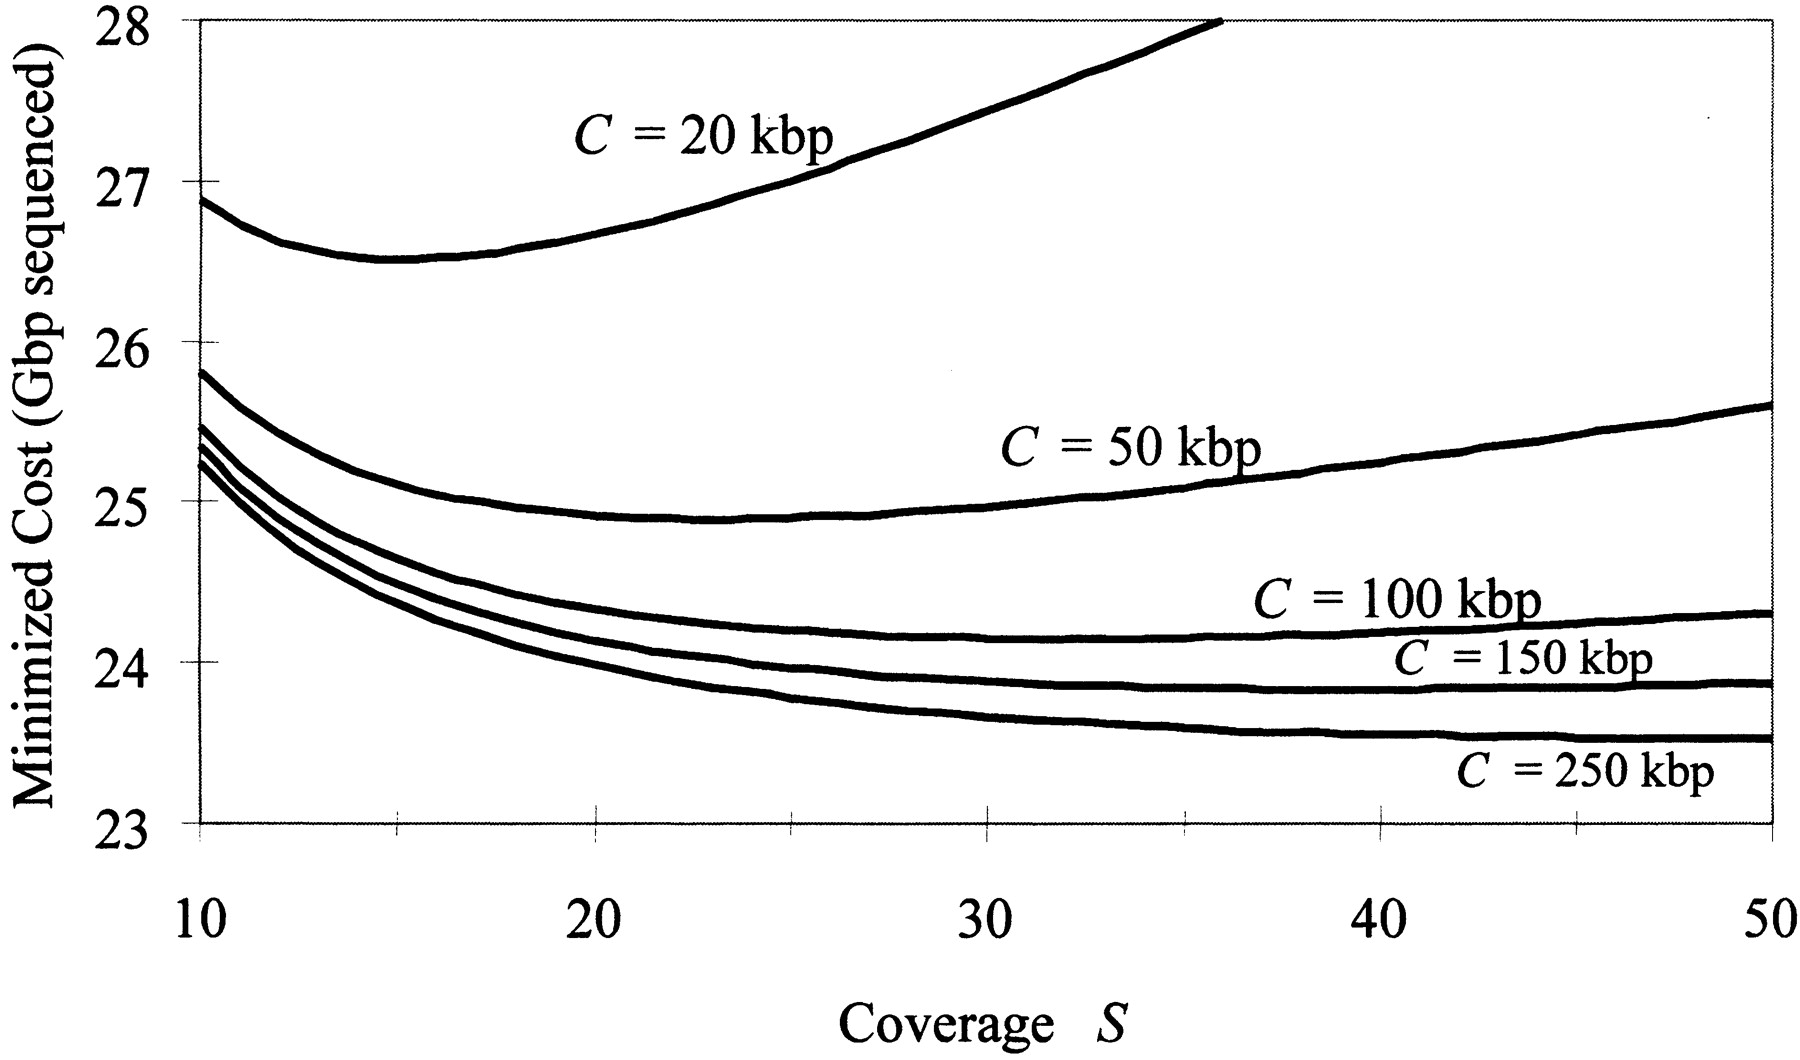
Expected cost vs. coverage S for selected values of clone length C, with k chosen to minimize cost in each case.
(Downloading may take up to 30 seconds. If the slide opens in your browser, select File -> Save As to save it.)
Click on image to view larger version.
Expected cost vs. coverage S for selected values of clone length C, with k chosen to minimize cost in each case.
 CiteULike
 Delicious
 Digg
Digg Facebook
 Google+
 Reddit
 Twitter
