
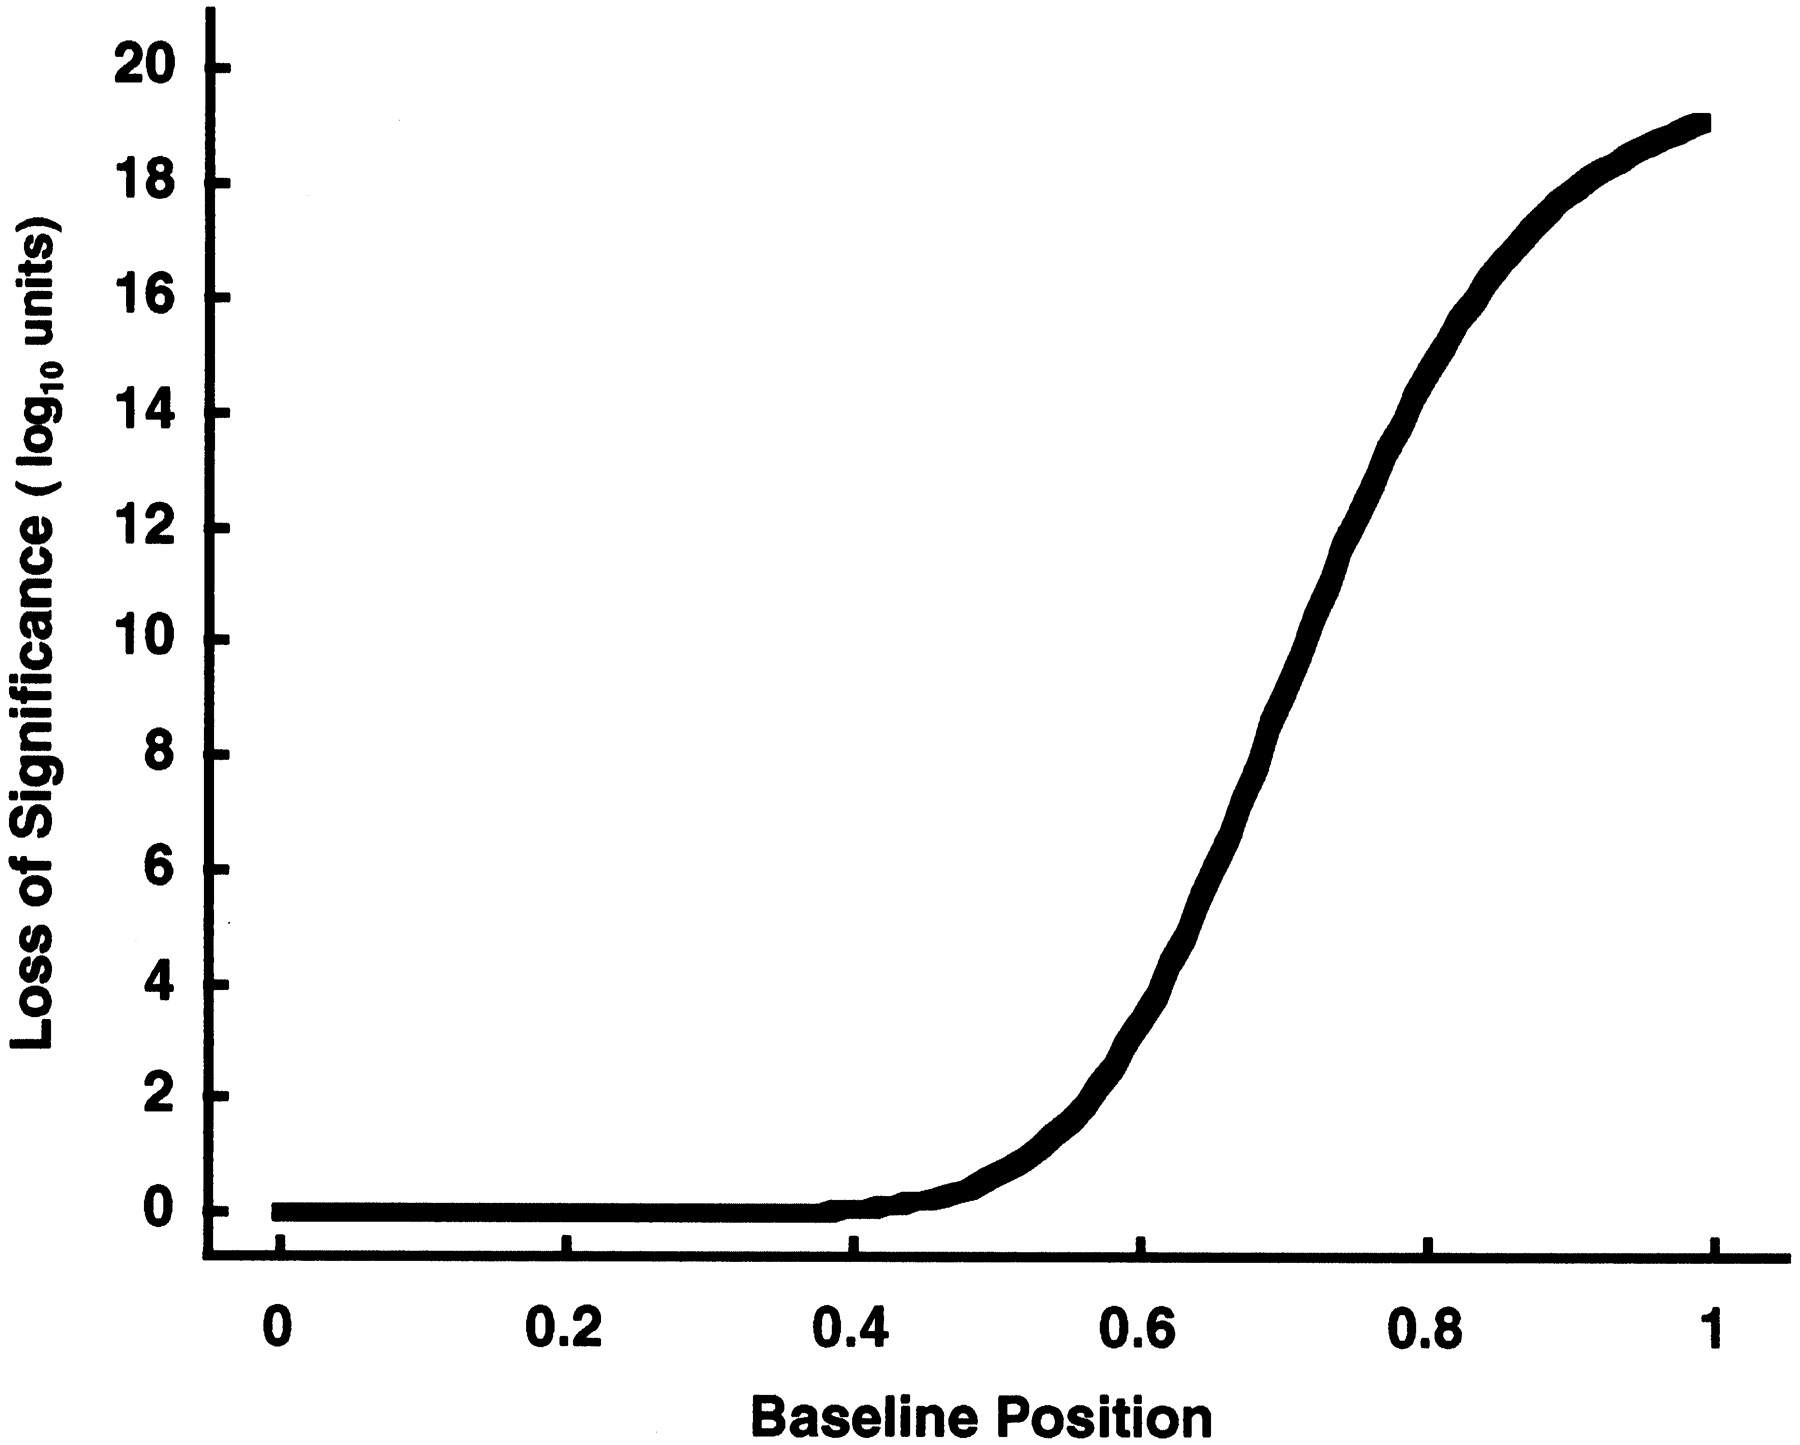
Figure 7.
Erosion of confidence increases as the baseline position increases toward the maximum. The number of samples (n = 22), the maximum intensity (xn = 1), and the traditional Dixon significance probability [log10(sp) = −20) are kept fixed throughout this example as in Fig. 5. The resulting erosion of confidence, i.e., the loss of statistical significance Δlog10(sp) from the traditional Dixon value, is plotted continuously as the baseline increases toward the allowed maximum intensity (see also Table 1).


