
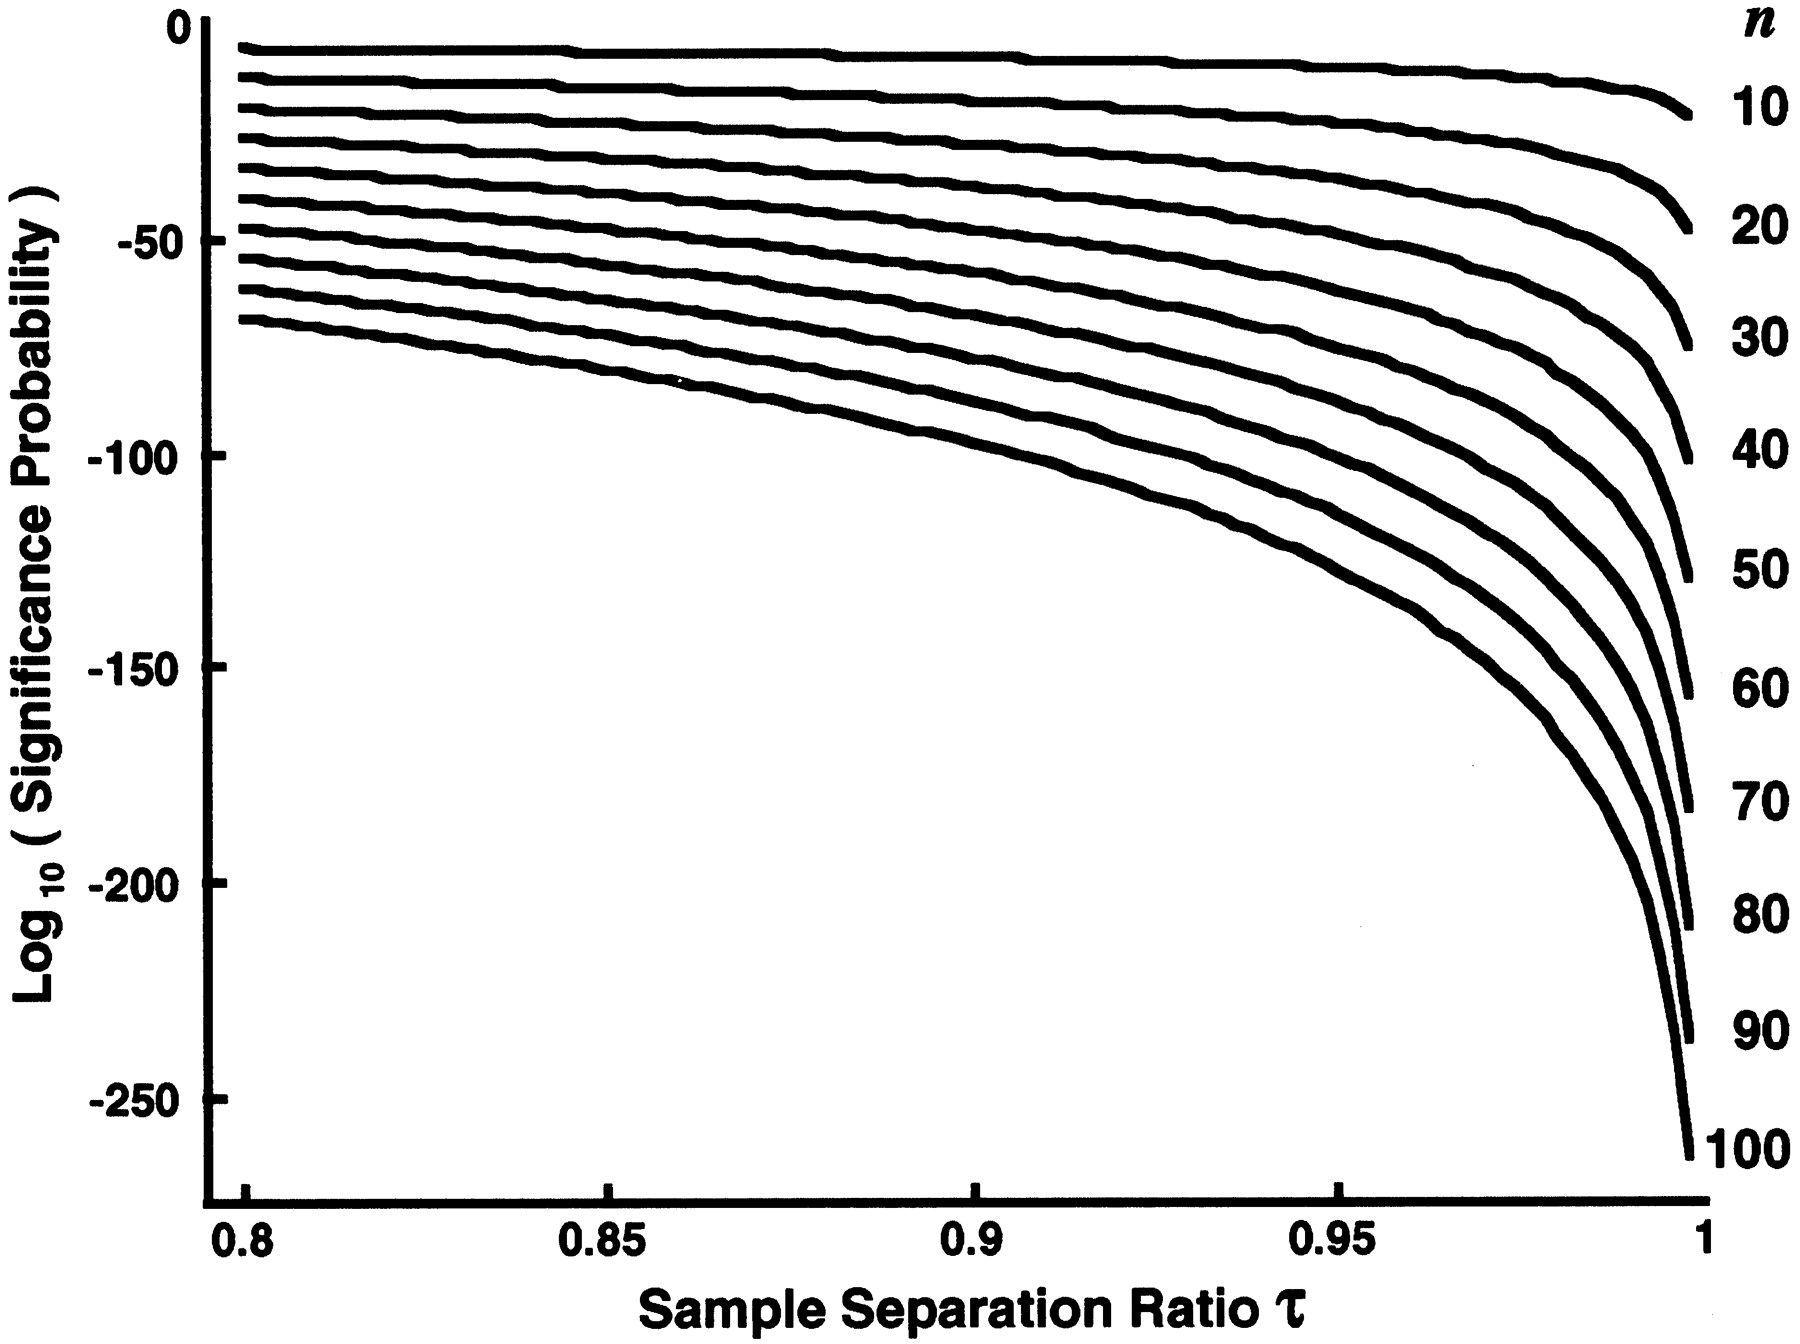
Figure 3.
Dependence of the Dixon theoretical statistical significance probabilities on the sample separation ratio at fixed number of samples taken. The logarithms of the Dixon theoretical statistical significance probabilities for discordancy in uniform samples (Barnett and Lewis 1978a) are plotted against the sample separation ratio τ ε [0.8, 0.995], (equations 1–6). Each theoretical curve (right) is at a different fixed number n of samples,n = [10, 20, ... , 100], respectively. τ near 1 reflects a largest sample being widely separated from the next largest sample when compared to the separation of the largest and smallest samples (see Fig. 6).


