
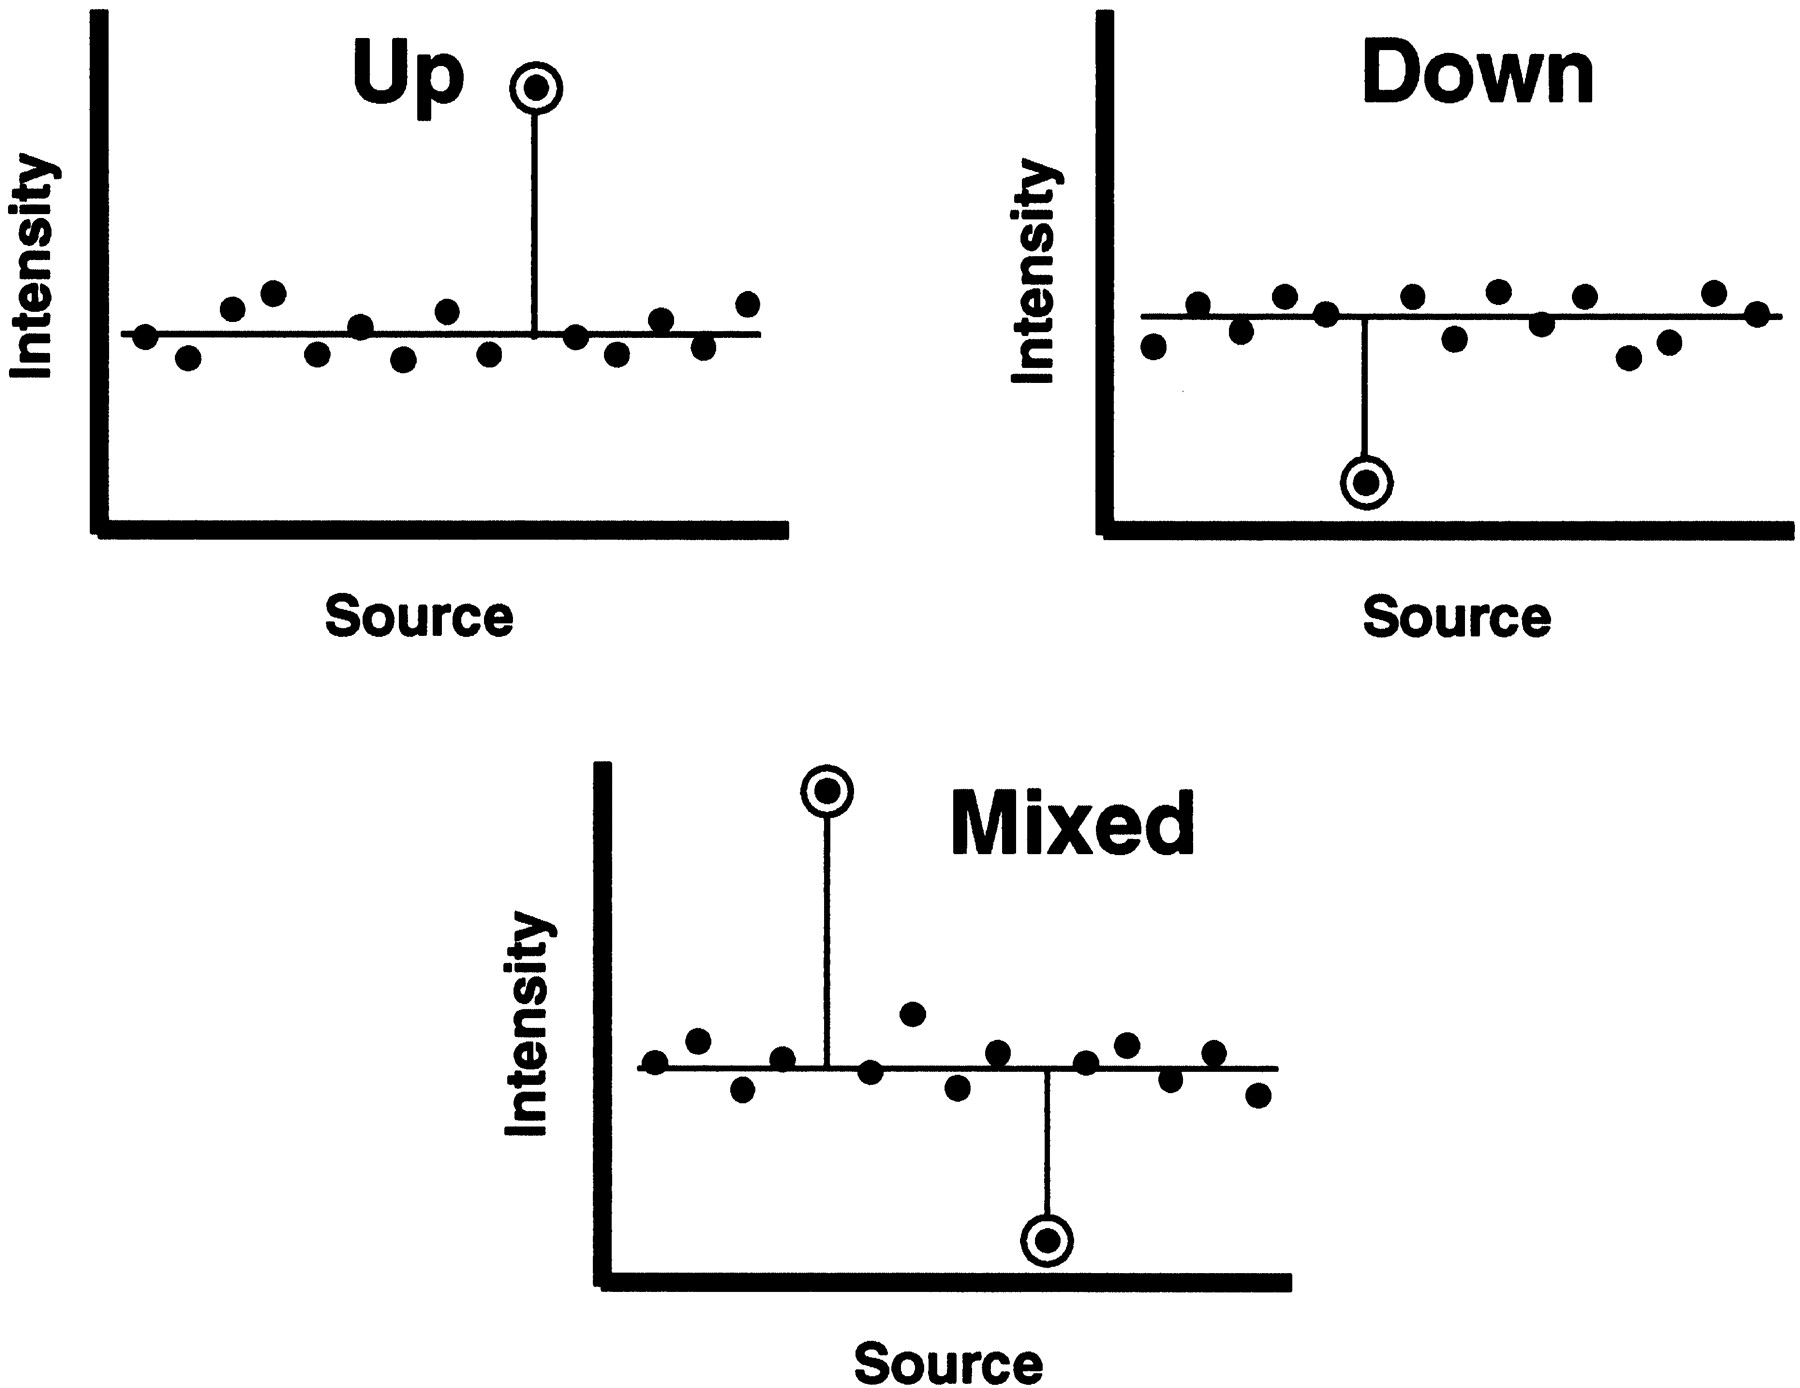
Figure 1.
Selective expression types. Examples of selective expression stereotypes—up, down, and mixed—are diagrammed. Intensities vs. sources from a source set are plotted in arbitrary order. In each diagram, it is presumed that the outstanding intensities are exceptionally large or exceptionally small, when compared against the other intensities; hence, selective expression. Selectively expressed intensities are indicated by encircled symbols.


