
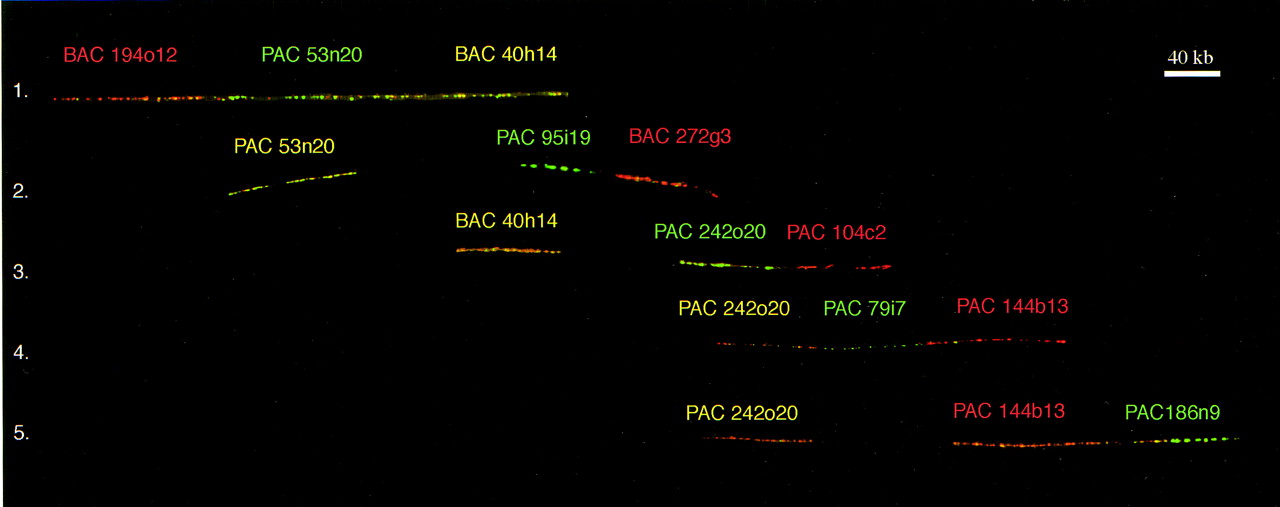
Figure 2.
A fiber-FISH image of the physical clone contig covering the MKS region and partly the MUL region. The contig was constructed by hybridizing three clones simultaneously on free DNA fibers. Each line in the figure represents one hybridization image. Biotin-labeled probes were detected with TRITC (red) and digoxigenin-labeled probes with FITC (green). The mixture of biotin and digoxigenin labels of the same probe resulted in a yellow signal. Also, the overlaps of different probes labeled with biotin and digoxigenin resulted in a yellow signal (the color in the name of each probe refers to the used label).


