
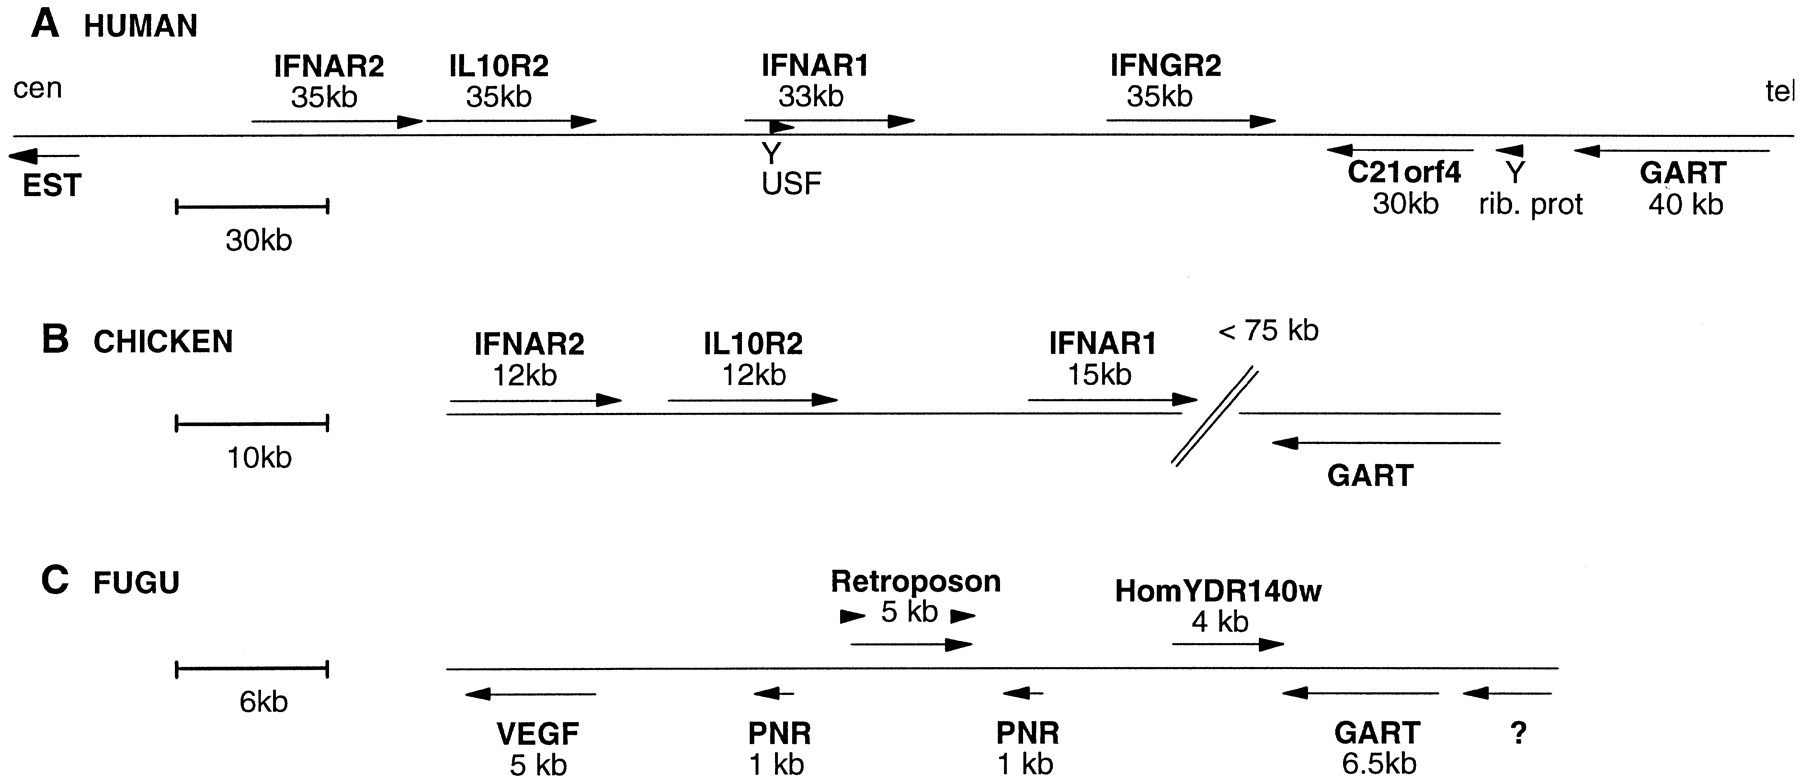
Structure of the genomic loci downstream of the GART gene in human, chicken, and Fugu: Genes are indicated with their names, size, and orientation of transcription (arrows). Scale is indicated in each panel. (A) Human locus on chromosome 21. Arrowheads labeled Y represent processed pseudogenes. (rib. prot) Ribosomal protein S5. The orientation relative to the centromere (cen) and telomere (tel) is indicated. (EST) The presence of a spliced EST. Regions sequenced for this study: 5′ of IFNAR2 (accession no. AF039905), IL-10R2 to IFNAR1 (accession no.AF039904 ), IFNAR1 to IFNGR2 (accession no.AF039907), IFNGR2 to GART (accession no. AF039906). The accession number for C21orf4 cDNA is AF045606. (B) Chicken locus. The distance between IFNAR1and GART has been measured by PFGE analysis (Fig. 5). Accession numbers are as follows: AF082664 (cDNA for cIFNAR1),AF082665 (cDNA for cIFNAR2), AF082666 (cDNA for cIL10R2), and AF082667 (CRII gene cluster). (C) Fugu locus (accession no. for the cosmid is AF083221): The question mark (?) represents a potential gene predicted with high confidence by both GRAIL (excellent exons) and GenScan (exon probability > 0.99).


