
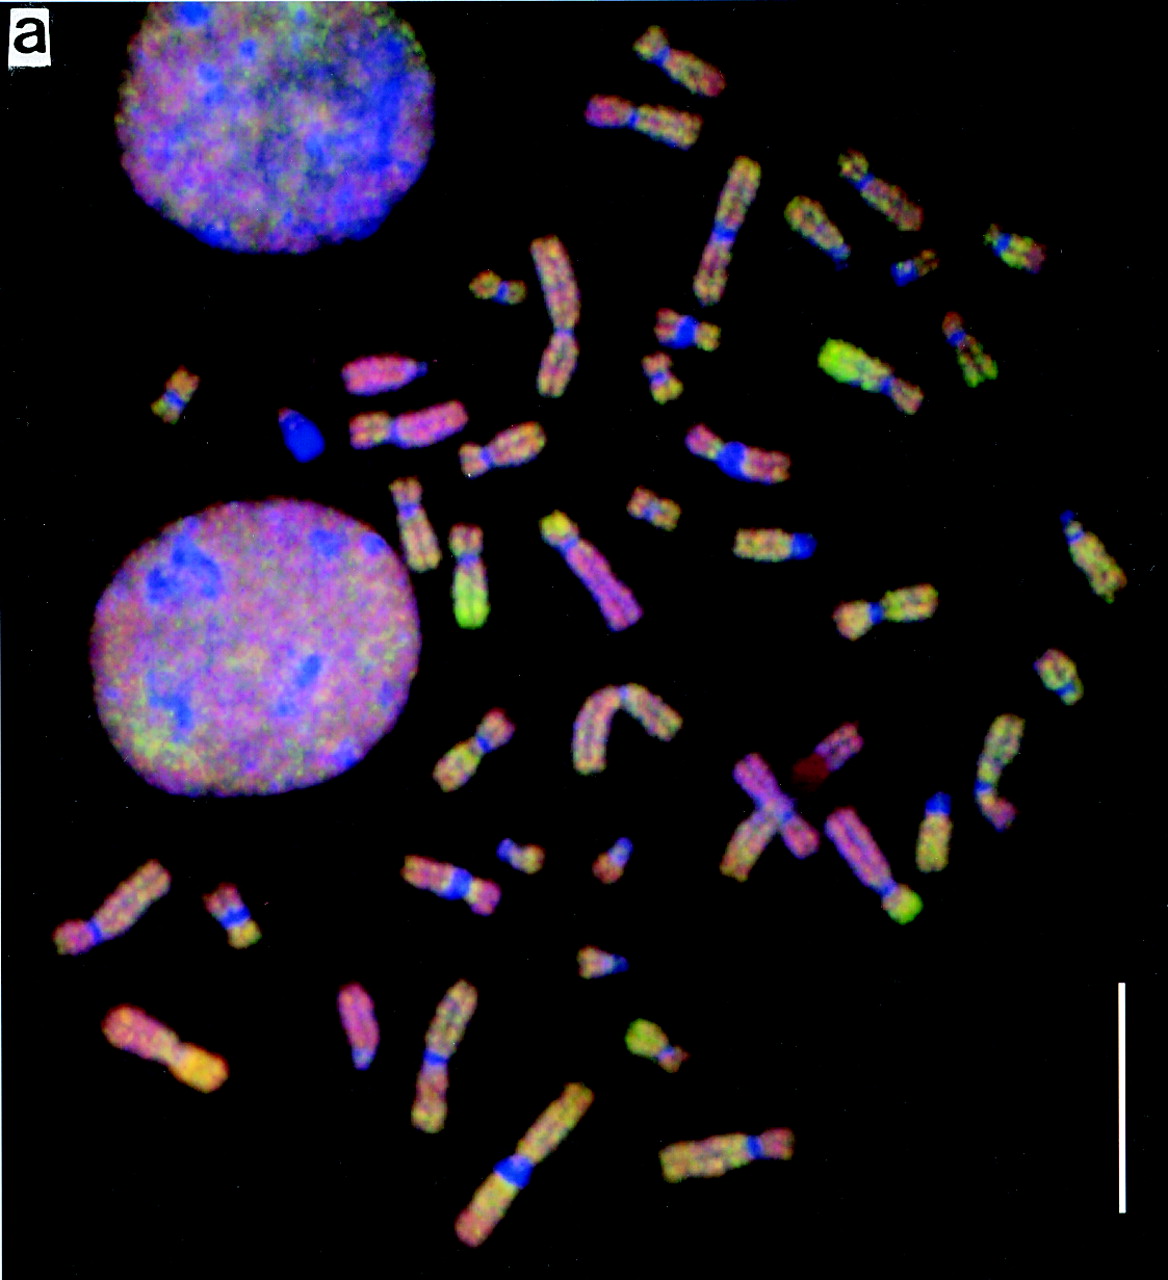
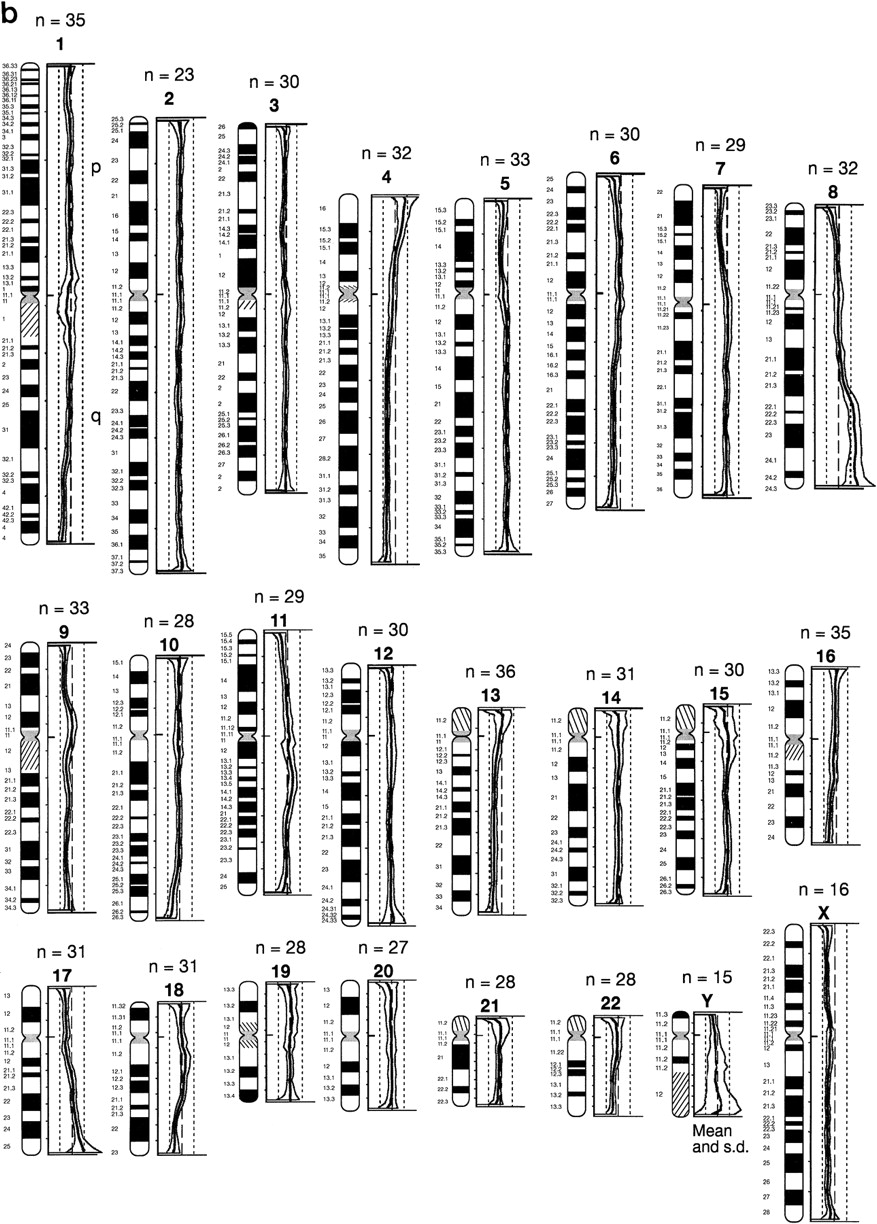
CGH results for PEO4 tumor DNA. (a) A digital image of a typical metaphase. Regions that are over-represented in the tumor are visualized as predominantly green, whereas regions that are under-represented or deleted from the tumor are seen as predominantly red. Bar, 10 μm. (b) The quantitative digital image analysis of fluorescence intensity ratios next to a diagram of the chromosome. The mean ratio (thick line) and ±1 s.e. (thin lines) of measurements from n metaphases for each chromosome are shown from pter to qter (top to bottom). The baseline value (1.0) representing the mean green-to-red ratio for the entire metaphase is shown as a broken line, and ratios 0.5 and 1.5 as dotted lines. Regions approaching a ratio of 0.5 were taken as losses; regions having a ratio >1.5 were taken as gains.


